⚠️ Alpha Disclaimer
This open-source project is currently under construction and is subject to frequent changes and updates. For more information about our alpha release, see our Alpha Disclaimer
Overview
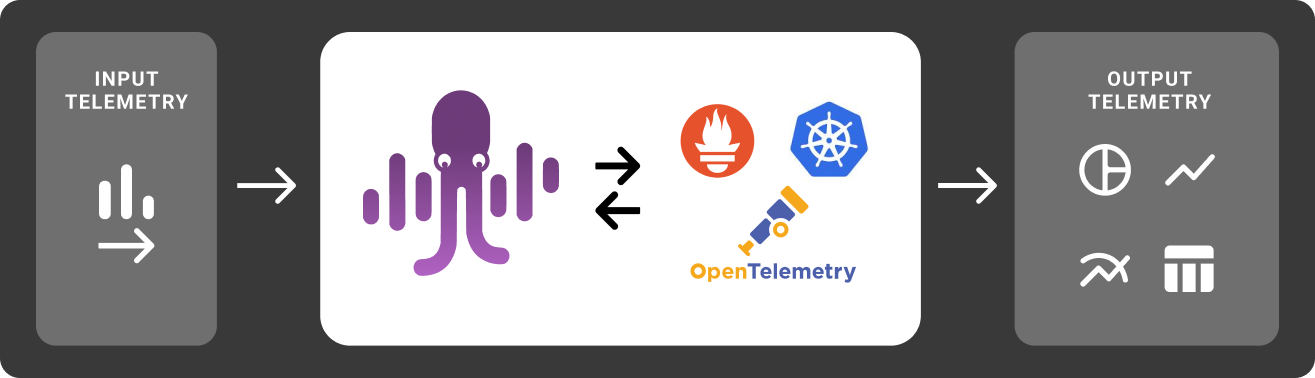
The MDAI Cluster provides a self-service control plane for OpenTelemetry, making it simple for users to oversee their observability telemetry and control costs efficiently.
📚 What is an MDAI Cluster?
Curious about what our cluster offers?
🌐 We're Open-Source
We will always be committed to improving open source, whether it's in-house or back to the community.
🏛️ Our Architecture
Curious about what super-powers our infrastructure?
🚀 Installation
Ready to install? We have a few options for both learning and production use!
🚢 Start Sending Data
Ready to send your MDAI Cluster data? We have a few methods.
📈 Usage Guide
Already installed a cluster, but want to learn more about usage?
Want to jump ahead to install? Wait no more!
Installation guide ⏭️
⚠️ DISCLAIMER
This alpha release is an early version of our open source solution and is intended for testing and feedback purposes only. Please note that there are many changes and enhancements planned for future iterations, and the current version represents just the initial phase of development.
Primary Functionality
The primary functionality of this alpha release is an installer for cloud-based telemetry pipelines running specifically in AWS environments. The installer is designed to facilitate the setup and provisioning of telemetry pipelines, allowing users to quickly deploy and configure the necessary components for monitoring and data collection.
Important Notes
- This release may contain bugs, limitations, and incomplete features. We encourage users to report any issues encountered during testing.
- The user interface and user experience (UI/UX) may undergo significant improvements in future updates.
- Features, configurations, and integrations are subject to change based on user feedback and development priorities.
- Data generated or collected during this alpha phase may not be representative of final production data.
Feedback and Contributions
We value your feedback and contributions to help us improve our open source solution. Please share your thoughts, suggestions, and bug reports with us via support@mydecisive.ai.
Thank you for participating in our alpha testing phase!
⏪ Back to Overview Next Step: Installation ⏩
Open-Source
The MDAI Cluster is a series of homegrown and external Open-Source projects.
Homegrown components - things we built
- Install Guide (you're in it!)
- InkOps Installer Toolkit
- CLI
- Analysis Modules
- Comprehensive UI
Externally built Open-Source tech we use
Read more about the tools that super power us!
Things we're contributing to...
Coming soon! Check back to learn more about where we're spending our efforts to improve Open-Source beyond MDAI
Want to jump ahead to install? Wait no more!
Installation guide ⏭️
Architecture Overview
- 10,000 ft. view
- 1,000 ft. view
- What super powers the MDAI Cluster?
- Why use these technologies together?
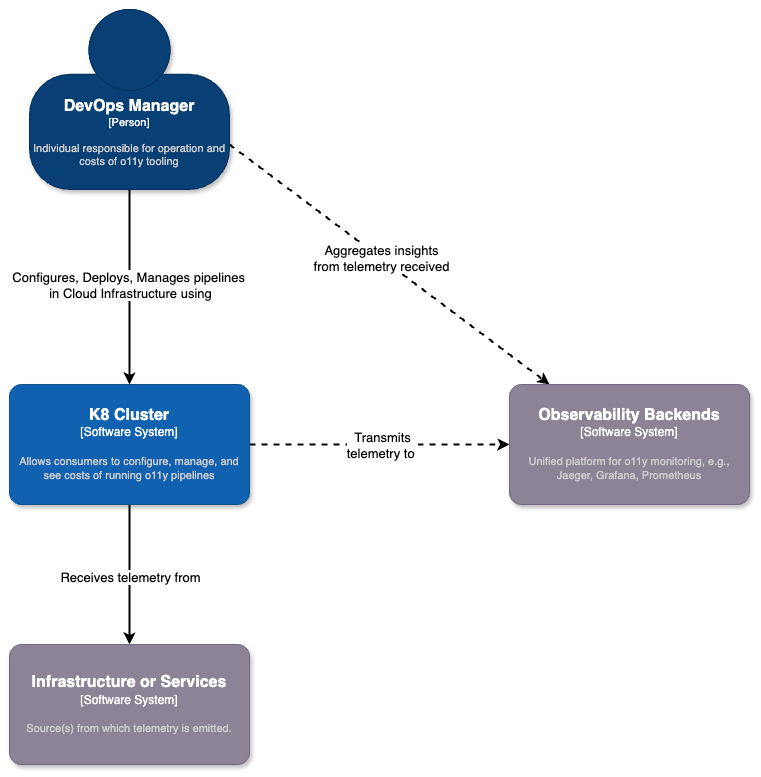
10,000 ft. view
We want to simplify the lives of DevOps teams by providing an on-prem (in your own cloud) solution that can give full control over telemetry pipelines, while maintaining existing use of Observability Platforms and/or tools.
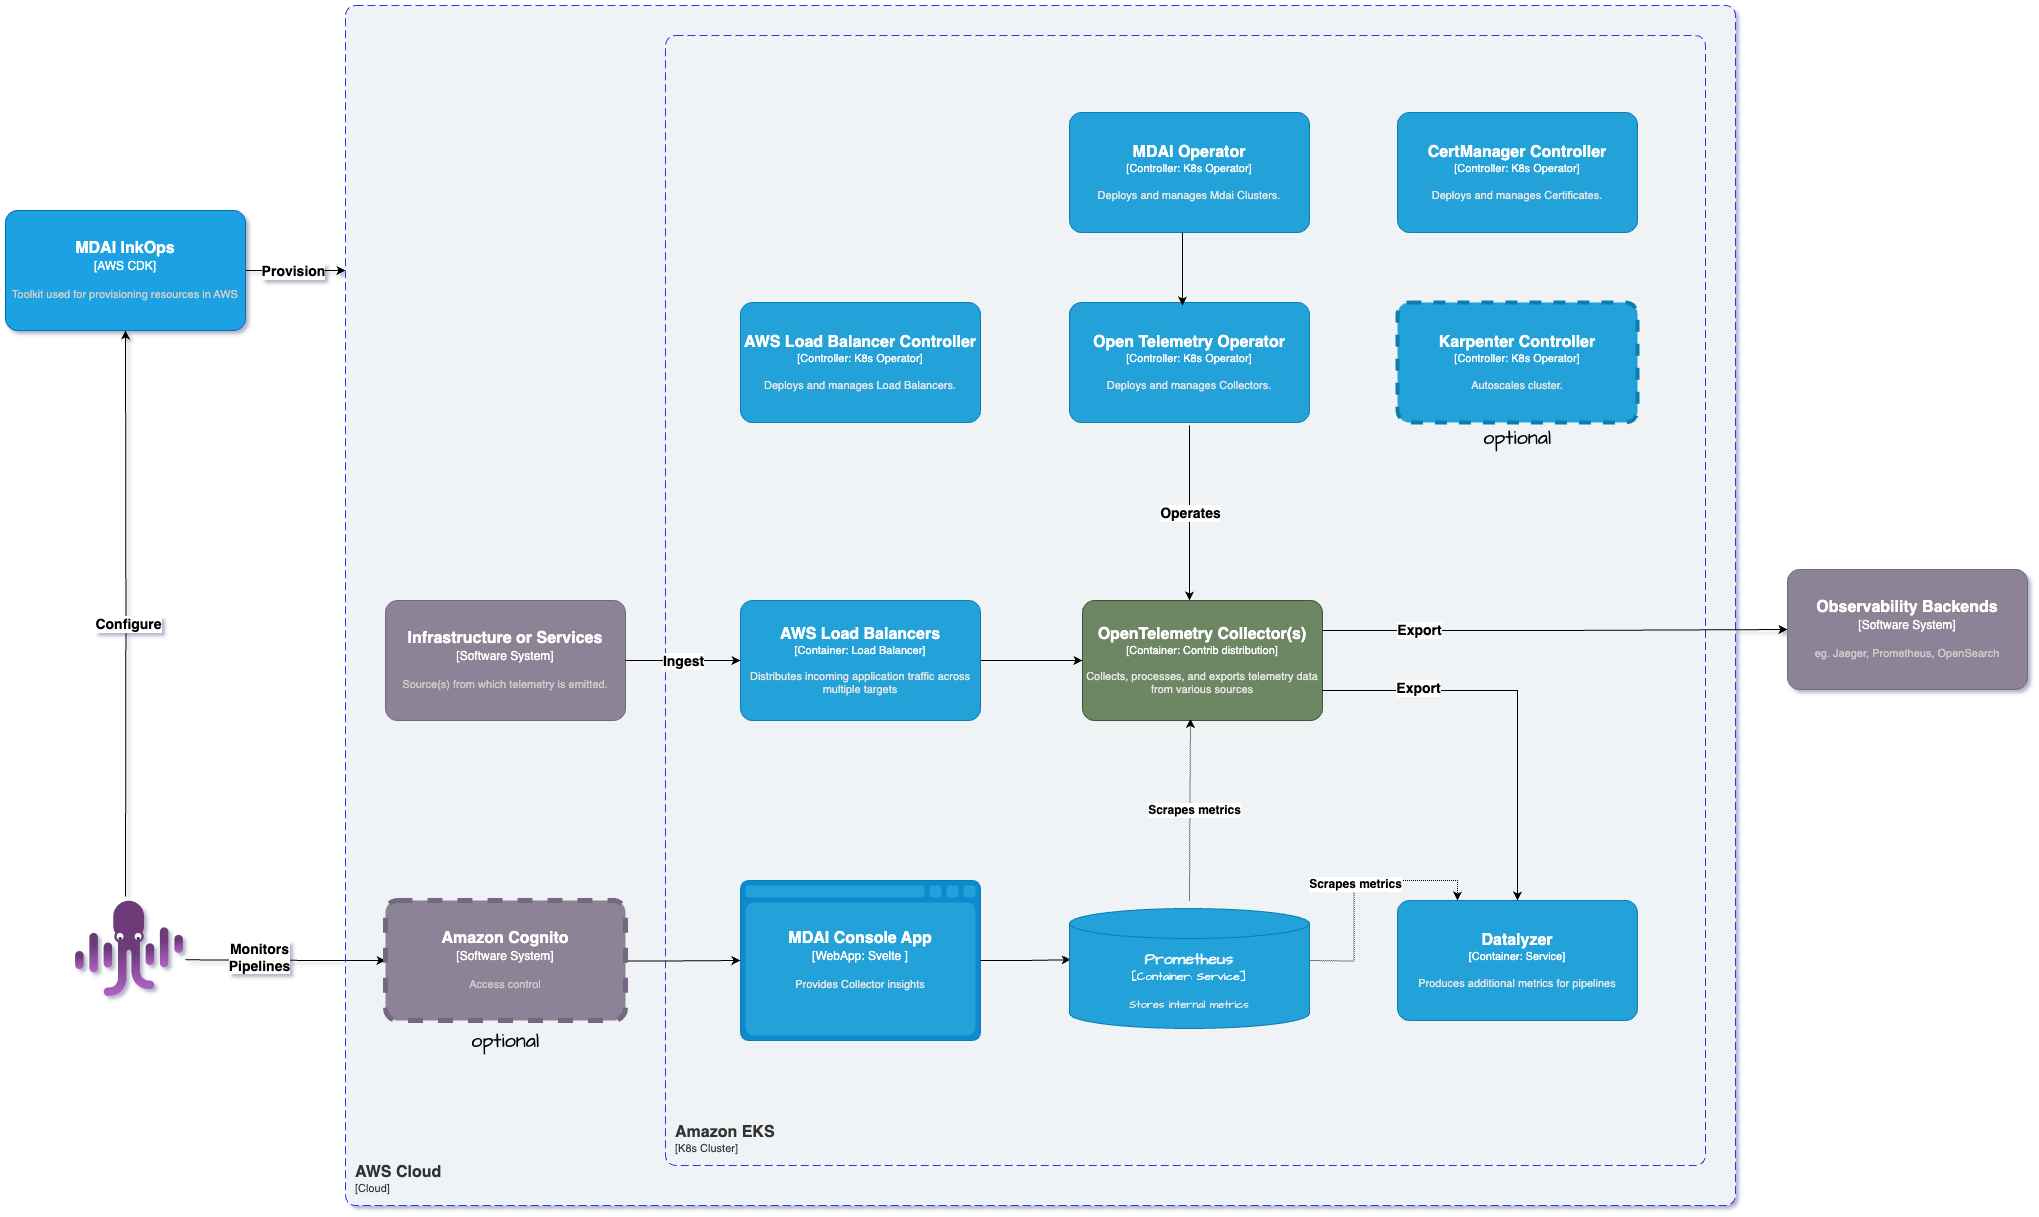
1,000 ft. view
Here's a brief diagram for how we are using our preferred technologies to build our infrastructure to help the DevOps community!
What super powers the MDAI Cluster?
Kubernetes (K8s)
Kubernetes is a powerful container orchestration platform that automates deployment, scaling, and management of containerized applications. It provides a flexible and scalable infrastructure for running modern microservices architectures, enabling rapid development, deployment, and scaling of applications. To learn more about k8s, visit kubernetes.io.
OpenTelemetry (OTel)
OpenTelemetry is an open-source observability framework that enables standardization and instrumentation of telemetry data across distributed systems. By integrating OTel with your applications, you can automatically capture and export metrics, traces, and logs, providing deep insights into application behavior, performance, and dependencies.
Prometheus
Prometheus is an open-source monitoring and alerting toolkit designed for reliability and scalability in dynamic environments like Kubernetes. It excels at collecting and storing time-series data, enabling real-time monitoring, querying, and alerting based on application metrics, service health, and resource utilization.
Why use these technologies together?
Unified Observability
Integrating Prometheus, OTel, and Kubernetes allows for unified observability across the entire application stack. You can collect metrics, traces, and logs from Kubernetes resources, containerized applications, and infrastructure components, providing holistic insights into system health, performance, and behavior.
Dynamic Environment Support
Kubernetes' dynamic nature requires a monitoring solution that can adapt to changes in application topology and resource allocation. Prometheus and OTel are well-suited for dynamic environments, providing auto-discovery, dynamic instrumentation, and flexible querying capabilities.
Standardization and Interoperability
OpenTelemetry promotes standardization and interoperability by providing consistent instrumentation and telemetry formats across different programming languages, frameworks, and observability tools. By integrating Prometheus and OTel, you can leverage a common telemetry format and instrumentation library, facilitating data sharing and analysis across the ecosystem.
Scalability and Extensibility
Prometheus and OTel are designed for scalability and extensibility, making them suitable for monitoring large-scale, distributed systems running on Kubernetes. You can scale your monitoring infrastructure horizontally to handle increased workload and integrate additional observability tools and services as needed.
Want to jump ahead to install? Wait no more!
Installation guide ⏭️
Introduction to the MDAI Cluster
- What the MyDecisive.ai (MDAI) MDAI Cluster is...
- What the MDAI Cluster is not...
- Why use the MDAI Cluster...
- How to use our docs...
- Contributing
- Who we want to help...
- Alpha Caveats
- License
What the MyDecisive.ai (MDAI) MDAI Cluster is...
-
An Open-Source, Cost-control tool for Telemetry Pipelines
-
A consolidated OpenTelemetry configuration and management tool
-
A self-monitoring container for all infrastructure
-
A pipeline analysis tool
What the MDAI Cluster is not...
-
A proprietary Observability vendor/platform
-
A standalone monitoring platform
-
A replacement for comprehensive monitoring solutions
-
A managed service
-
A multi-cloud supported tookit (AWS Only)
Why use the MDAI Cluster...
Cost savings
Why send you data when you don't have to? Prevents data from being emitted to configured “muted” destinations
Control
Enables users to take control in reducing telemetry flow in their pipelines.
How to use our docs...
- Installation - Install our infrastructure.
- Post-installation Usage - How to use the Cluster Post-Install
Contributing
Want to help build the future of Telemetry Pipelines? Checkout our Contribution Page to find out how to help.
Who we want to help...
- DevOps Managers
- DevOps Engineers
Alpha Caveats
Warning: This codebase is experimental and in active development. Proceed with caution and use at your own risk. Please review our expansive list of expectations for the limitations of this release.
License
MyDecisive.ai MDAI Cluster 2024 by DecisiveAI, Inc. is licensed under Apache 2.
Want to jump ahead to install? Wait no more!
Installation guide ⏭️
⚠️ Alpha Disclaimer
This open-source project is currently under construction and is subject to frequent changes and updates. For more information about our alpha release, see our Alpha Disclaimer
Supported Installation Methods
There are currently two supported methods for installing an MDAI Cluster:
- Local - on your machine
- AWS - in your AWS account
Local Installation
Want to try the magic locally before you install an MDAI Cluster in the cloud?
Check out our Quick Start Guide to learn how to test the MyDecisive MDAI Cluster in a local environment.
AWS Installation
Ready to visualize your observability pipelines and identify your top cost drivers?
Install an MDAI Cluster in AWS.
Additional installation methods will be supported in the future.
💻 Go to Local Install ⏭️
☁️ Go to AWS Install ⏭️
Quick Start - Introduction
We hope that deploying an MDAI Cluster locally will help you to:
Using our local installation method, we hope to...
- Help you install our infrastructure in less than 5 minutes.
- Validate, locally, that the MDAI Cluster is a great tool for your telemetry management needs.
- Fall in love with us and our solution before you install in the cloud.
Getting Started
To begin visualizing and managing your telemetry pipelines using an MDAI Cluster, you will need to complete the following steps:
- 🛠️ Configure it
- 🚀 Deploy it (locally)
- 📈 Send telemetry to it
- 🔑 Access it
- ✅ Verify it!
Ready... Set...
🏃 Let's get started! 🏃♀️
Next Step: Prerequisites ⏩
Prerequisites
System Dependencies
Currently, our documentation is tailored for users operating on Linux or Mac computers. Additionally, it assumes you have the following:
- You have 🍺 homebrew installed.
- You’re using bash, but you can modify these configurations and commands as needed for your preferred command line interface.
- If you're using MacOS, you'll also need XCode Commandline Tools installed.
Note on user requirements
We aim to make our solutions accessible to everyone. However, we recommend having an intermediate understanding of OpenTelemetry and Kubernetes, or a strong determination, before proceeding with this installation.
Here are a few great resources for ramping up on these subjects:
⏪ Back to Quick Start Next Step: Local Installation ⏩
Installation
There are three options for installation:
-
Semi-automatic Install - I want to install all system dependencies myself to be aware of and manage the MDAI requirements alongside my other software requirements.
-
Automated Install - I want the fastest method for installation possible, so I can skip ahead to testing out the MDAI Cluster! I'm not worried about how the system dependencies impact my other development environments.
-
CLI Install - Our brand new recommended method for installing and managing MDAI clusters locally combines the benefits of the first two methods and has fewer dependencies.
Choose your adventure:
Option 1: Semi-Automatic Install ⏩
Option 2: Automated Install ⏭️
Option 3: CLI Install ⏭️
⏪ Back to Prerequisites Next Step: Semi-automatic Install ⏩
Semi-Automated installation
Check us out!
First things first, you have to check out our MDAI infrastructure installation repo.
git clone https://github.com/DecisiveAI/mdai-inkops.git
Prerequisites
As mentioned, the only manual step for this install method is to enable you to have full visibility and control of your system dependencies.
- Install Go (1.20 or higher).
- GOBIN environment variable is set; if unset, initialize it appropriately, for example:
export GOBIN=${GOBIN:-$(go env GOPATH)/bin}
- Install node
- Install docker
- Install helm
- Install kind for local cluster management using docker containers
Install Commands
make -f ./make/Makefile-local-recipes create-mdai-semi-auto
Note: Once the MDAI Cluster installed your k8s context will be switched automatically to new cluster.
You may run into an error running this command related to the docker daemon. Please see our Troubleshooting Guide to see if this issues is relevant to you and how to resolve it.
⏪ Back to Install Next Step: Configure ⏩
Automated installation
Check us out!
First things first, you have to check out our MDAI infrastructure installation repo.
git clone https://github.com/DecisiveAI/mdai-inkops.git
Prerequisites
Our automated installation process is setting up all the required dependencies like
- Docker
- Kind cluster
- Node
- Go
- Helm (we support Helm v3.13.0 and later)
Here are installation steps:
- Install kind for local cluster management using docker containers
- Run automated installation script
make -f ./make/Makefile-local-recipes create-mdai
Note: Once the MDAI Cluster installed your k8s context will be switched automatically to new cluster.
You may run into an error running this command related to the docker daemon. Please see our Troubleshooting Guide to see if this issues is relevant to you and how to resolve it.
⏪ Back to Semi-Automated Install Next Step: Configure ⏩
Install and manage local MDAI cluster with CLI
Our CLI will help you install and manage MDAI clusters locally.
Prerequisite
Since we are using kind cluster you have to have Docker installed.
Download and install MDAI CLI
Install prebuilt binary via shell script
This command will download and install release v.0.1.0, you can check and download the latest release here.
curl --proto '=https' --tlsv1.2 -LsSf https://github.com/decisiveai/mdai-cli/releases/download/v0.1.0/mdai-installer.sh | sh
Install via Homebrew
To install prebuilt binaries via homebrew
brew install decisiveai/tap/mdai
Install MDAI cluster
To install MDAI cluster into local kind cluster run
mdai install
It will take couple minutes to spin up your cluster and have all k8s pods up and running.
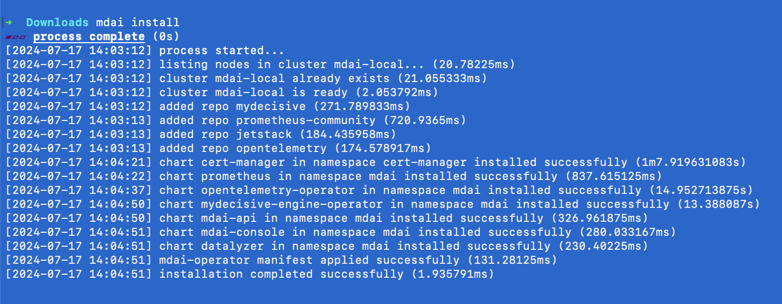
You can check pod status by running
kubectl get pods --all-namespaces
Which should look like:
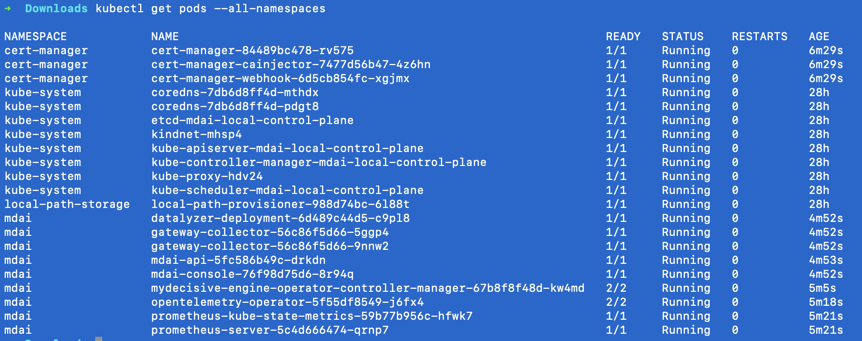
Manage MDAI cluster
Our CLI has a sample cluster defined and built in into installation process.
It starts two replicas of "gateway" OTEL collectors.
Let's check OTEL collectors configuration by running:
mdai get --config otel
For a full reference of CLI commands check here or run:
mdai --help
⏪ Back to Automated installation Next Step: Verify ⏩
⏲️ Time to Configure OpenTelemetry! 📈
Warning: ⚠️ This configuration method is deprecated ⚠️
New documentation how to use mdai operator configuration instead is coming soon.
Let's update your MDAI Cluster's OTel configuration file.
🤔 You've got a couple options...
Option 1 - 👢 Bootstrap our built-in Collector Configuration
We have provided a default configuration for a simplified version of the OpenTelemetry collector at values/otelcol-config.yaml. Using our boilerplate can accelerate your deployment and configuration using OpenTelemetry.
MOARRR CHOICES!
You can...
- Use the config as is to accelerate through configuration
- Making modifications right now that better fit your pipeline needs
Learn more about the specifications for the OTEL Collector to make the best decisions for your telemetry pipelines configuration needs.
Option 2 - 🧳 Bring Your Own Configuration
Want to use a custom or tried-and-true OTel configuration file that already works for you?
Simply update the configuration file at values/otel-config.yaml.
Apply change
After you've configured you OTel pipelines to your heart's desire, you can apply your changes by running
# Update config file within the cluster directory, it will get applied to your cluster instance automatically via a k8s operator.
kubectl apply -f values/otel-config.yaml
⏪ Back to Install Next Step: Verify ⏩
Verify local MDAI Cluster
Configure MDAI Console (UI) to use localhost
Find your MDAI Console pod
One of the pods installed will contain a web app. Let's list out all cluster pods to find what your pod's name is.
Note: the pod that starts with mdai-console-<hash_id>
kubectl get pods
Enable port forwarding from cluster to localhost
<!-- Example kubectl port-forward mdai-console-abcd123-xyz1 5173:5173 -->
kubectl port-forward <POD_NAME> <PORT>:<PORT>
View Console on your desired port
You should now be able to view the MDAI Console at your newly configured port, in our case, we used :5173
🐙🎉 View yours at http://localhost:<configured_port>
⏪ Back to Configure Next Step: Generate & Collect Telemetry ⏩
Validate data flow
- View the local MDAI console
- As telemetry flows through the MDAI Cluster, you will see counts increase in the console, color-coded by telemetry type. 🐙🎉
Note: Data flowing to
debugexporters are not counted towards data flow totals in the right sidebar
⏪ Back to Generate & Collect Telemetry Next Step: AutoScaling ⏩
MDAI Cluster Life Cycle Management
Overview
MDAI Cluster lifecycle management involves post-creation operations to control the behavior and state of the components of each MDAI Cluster or the MDAI Cluster as a whole.
The common use cases for lifecycle management are highlighted below...
- Disable MDAI Cluster Ingress - Disable ingress to validate that data flow has stopped.
- Enable MDAI Cluster Ingress - Enable ingress to validate that data flow has been re-instantiated.
- Uninstall MDAI Cluster - Destroy all artifacts associated with the MDAI Cluster.
🚨 Important considerations for Life Cycle Management 🚨
- Ensure that you have the necessary permissions and access rights to perform these operations.
- Always review and test configurations before applying changes to avoid unintended consequences.
- Use caution when destroying a cluster, as it will permanently delete all associated resources.
⏪ Back to: Validate Next Step: Disable the MDAI Cluster ⏩
Disable MDAI Cluster Ingress
You may need to temporarily halt incoming traffic to perform maintenance or troubleshoot issues without impacting data flow.
How to Disable...
Manual
- Set replica count to
0invalues/params-values-otel.yaml:
spec:
  # 2 replicas recommended
  replicas: 0
- Apply config to cluster
kubectl apply -f values/params-values-otel.yaml
Automated
Check back soon, we're working on an automated flow for disabling your MDAI Cluster.
⏪ Back to: Lifecycle Management Overview Next Step: Enable MDAI Cluster ⏩
Enable MDAI Cluster Ingress
After completing any tasks related to disabling your MDAI Cluster instance (i.e., maintenance or MDAI Cluster data flow resolution), you likely want to resume ingress and ensure that data flow resumes smoothly.
How to Enable...
Manual
- Set replica count to
2invalues/params-values-otel.yaml:
spec:
  # 2 replicas recommended
  replicas: 2
- Apply config to cluster
kubectl apply -f values/params-values-otel.yaml
Automated
Check back soon, we're working on an automated flow for disabling your MDAI Cluster.
⏪ Back to: Disable MDAI Cluster Next Step: Uninstall MDAI Cluster ⏩
Uninstall the MDAI Cluster
Tired of using the MDAI Cluster locally? 😭 We're sorry to see you go, but we understand.
If you have feedback for us, please let us know why!
Automated uninstall
When decommissioning a cluster or performing a clean-up operation, you need to delete all resources and configurations. Follow the steps below to uninstall your local MDAI Cluster.
Ensure you have the correct k8s context selected.
Make sure your k8s context is set to kind-mdai-local cluster:
kubectl config get-contexts
Switch the context if needed:
kubectl cluster-info --context kind-mdai-local
Uninstall Cluster
Run automated de-installation script
make -f ./make/Makefile-local-recipes delete-mdai
Optional: Uninstall all helm artifacts
If you want to remove all helm artifacts installed (you don't use it your other local setup), run the following
make -f ./make/Makefile-local-recipes delete-mdai-all
Data Persistence - Prometheus
Currently, there is no data persistence for Prometheus. If you destroy your MDAI Cluster, you'll also be destroying your prometheus instance and all associated data. 🪦
Until MDAI is able to support a more robust persistence layer or snapshot capability, we recommend using a remote storage option for your persistence needs.
⏪ Back to: Enable MDAI Cluster Next Step: Congrats ⏩
🎉 🐙 🎉 You did it! 🎉 🐙 🎉
That's all for now!
We hope you've enjoyed using the MDAI Cluster for visibility into your o11y costs and starting taking telemetry pipeline management back into your hands.
📚 Learn more!
Are you interested in learning about advanced configuration options?
Do you have questions, concerns, feedback?
Please give us your unfiltered thoughts!
- Fill out our Feedback form
- Email our Support Team support@mydecisive.ai
⏪ Back to: Installation Next up: MDAI Console Usage ⏭️
🪄 Introduction 🪄
We hope that deploying an MDAI Cluster to AWS will help you to:
- ☁️ Manage your MDAI Cluster in the cloud.
- 🔐 Enable access to your MDAI Cluster via your AWS account settings, whether it's for multiple users or just yourself.
- 🌎 Use DNS to connect your custom domain to any MDAI Cluster entry-points.
- 💵 Visualize your pipeline data flows, giving you instant insights into your telemetry cost drivers and the net impact of your defined data processors.
Future versions of the MDAI Cluster will be compatible with other cloud service providers.
Getting Started
To begin visualizing your telemetry pipelines using an MDAI Cluster, you will need to complete the following steps:
- 🛠️ Configure it
- 🚀 Deploy it
- 📈 Send telemetry to it
- 🔑 Access it
- ✅ Verify it!
Ready... Set...
🏃 Let's get started! 🏃♀️
Next Step: Prerequisites ⏩
AWS Install Prerequisites
System Requirements
Ensure your development environment has access to all of the following software and settings.
Note: This page assumes you’re using bash, but you can modify these configurations and commands as needed for your preferred command line interface.
- Install Go (1.20 or higher) from source or use homebrew
brew install go - GOBIN environment variable is set; if unset, initialize it appropriately, for example:
export GOBIN=${GOBIN:-$(go env GOPATH)/bin}
Note: We do install Helm automatically, however, it's important to note that we support Helm v3.13.0 and later. If you have helm installed, but at an earlier version, we cannot guarantee our install process will work as expected.
AWS Requirements
- Install AWS CLI
- Install AWS CDK Toolkit
- Install AWS EKSCTL
User Requirements
We never desire to exclude anyone from using our solutions. Instead we encourage and inspire you to obtain an intermediate knowledge of AWS (or a ton of grit) before continuing with this install. Here's a great AWS Training resource!
⏪ Back to: Getting Started Next Step: Setup AWS CLI ⏩
Programatic Access for AWS CLI
To deploy an MDAI Cluster, we use the AWS CLI for access and control to the various AWS tech we leverage.
Pre-requisites
Before you install a cluster, you will need to Create an AWS IAM Admin Account
Setup the AWS CLI
We've found the Gettings Started with the AWS CLI gude extremely helpful in setting up everything from pre-requisites, to programatic access via your desired terminal tools.
There are two methods we recommend for programatic access to your AWS resources via the AWS CLI, though there are more that you can access the CLI with and can be found here
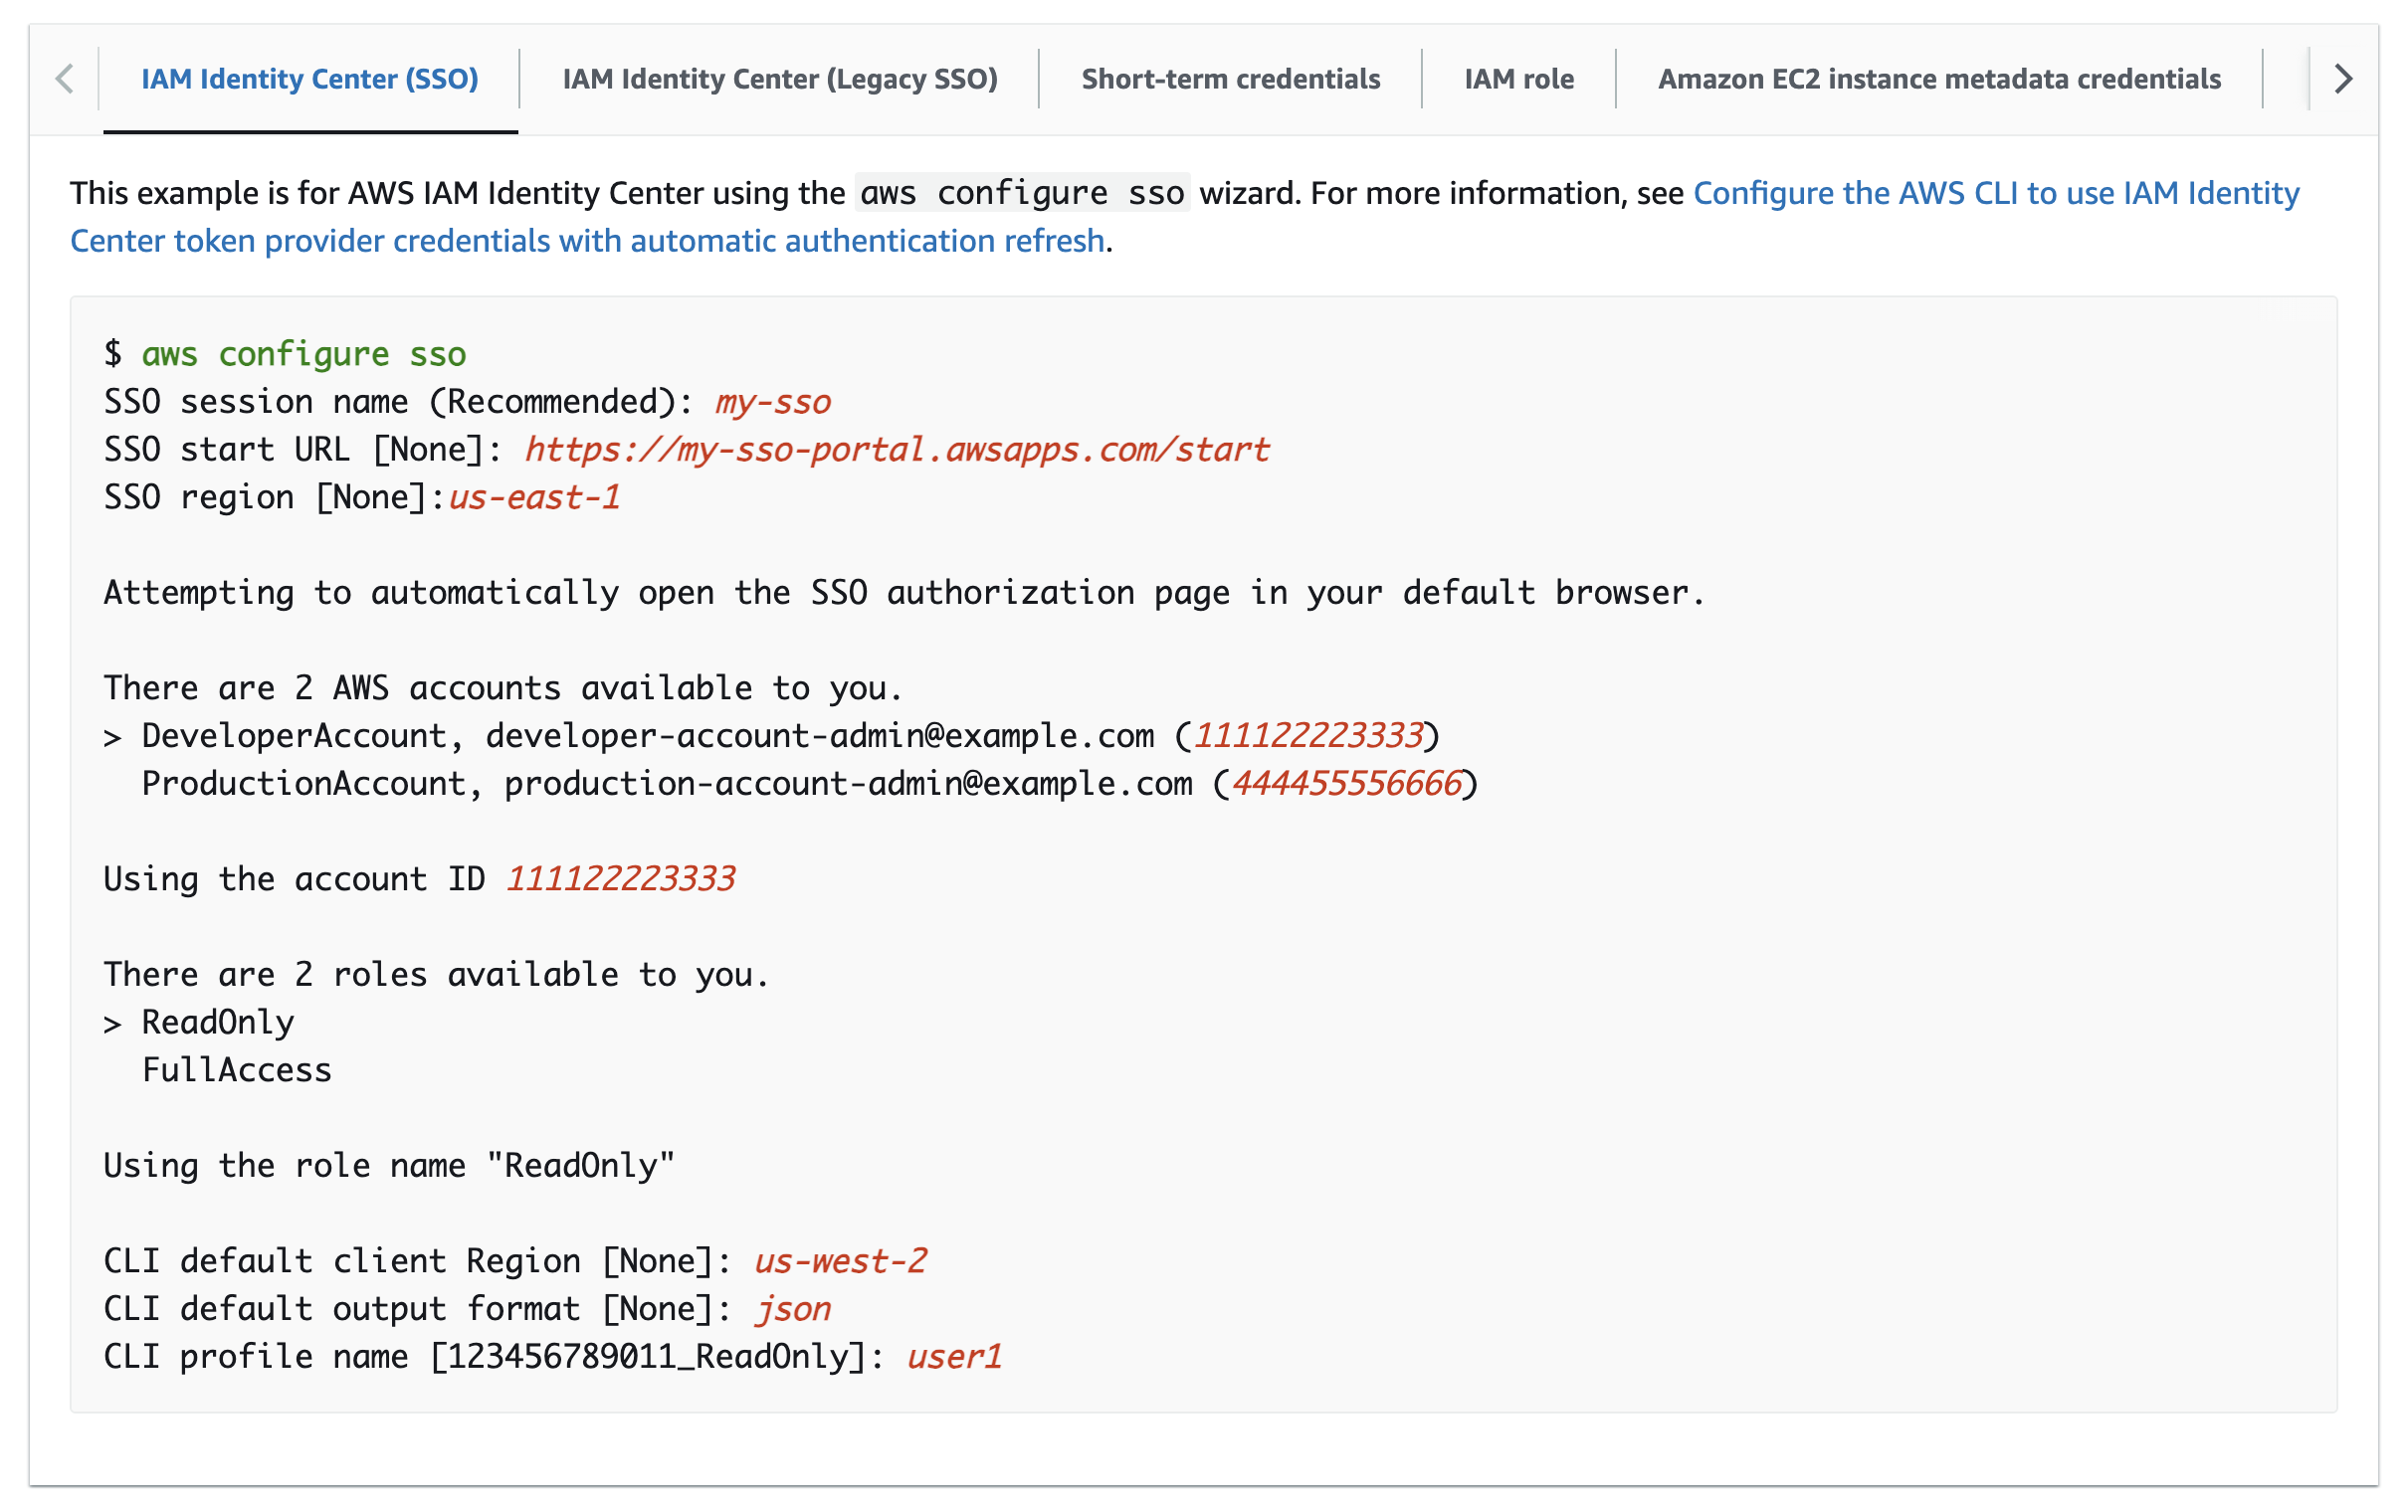
Option 1: AWS SSO (recommended)
The AWS SSO option is more secure and generally recommended by AWS and AWS Practitioners.
Configure
Login
# Assumes your machine is already configured access to AWS via `aws configure sso`.
aws sso login --profile <AWS_PROFILE>
Option 2: Short-term credentials
The AWS Short-term credentials option is light-weight and simple to setup with a few commands.
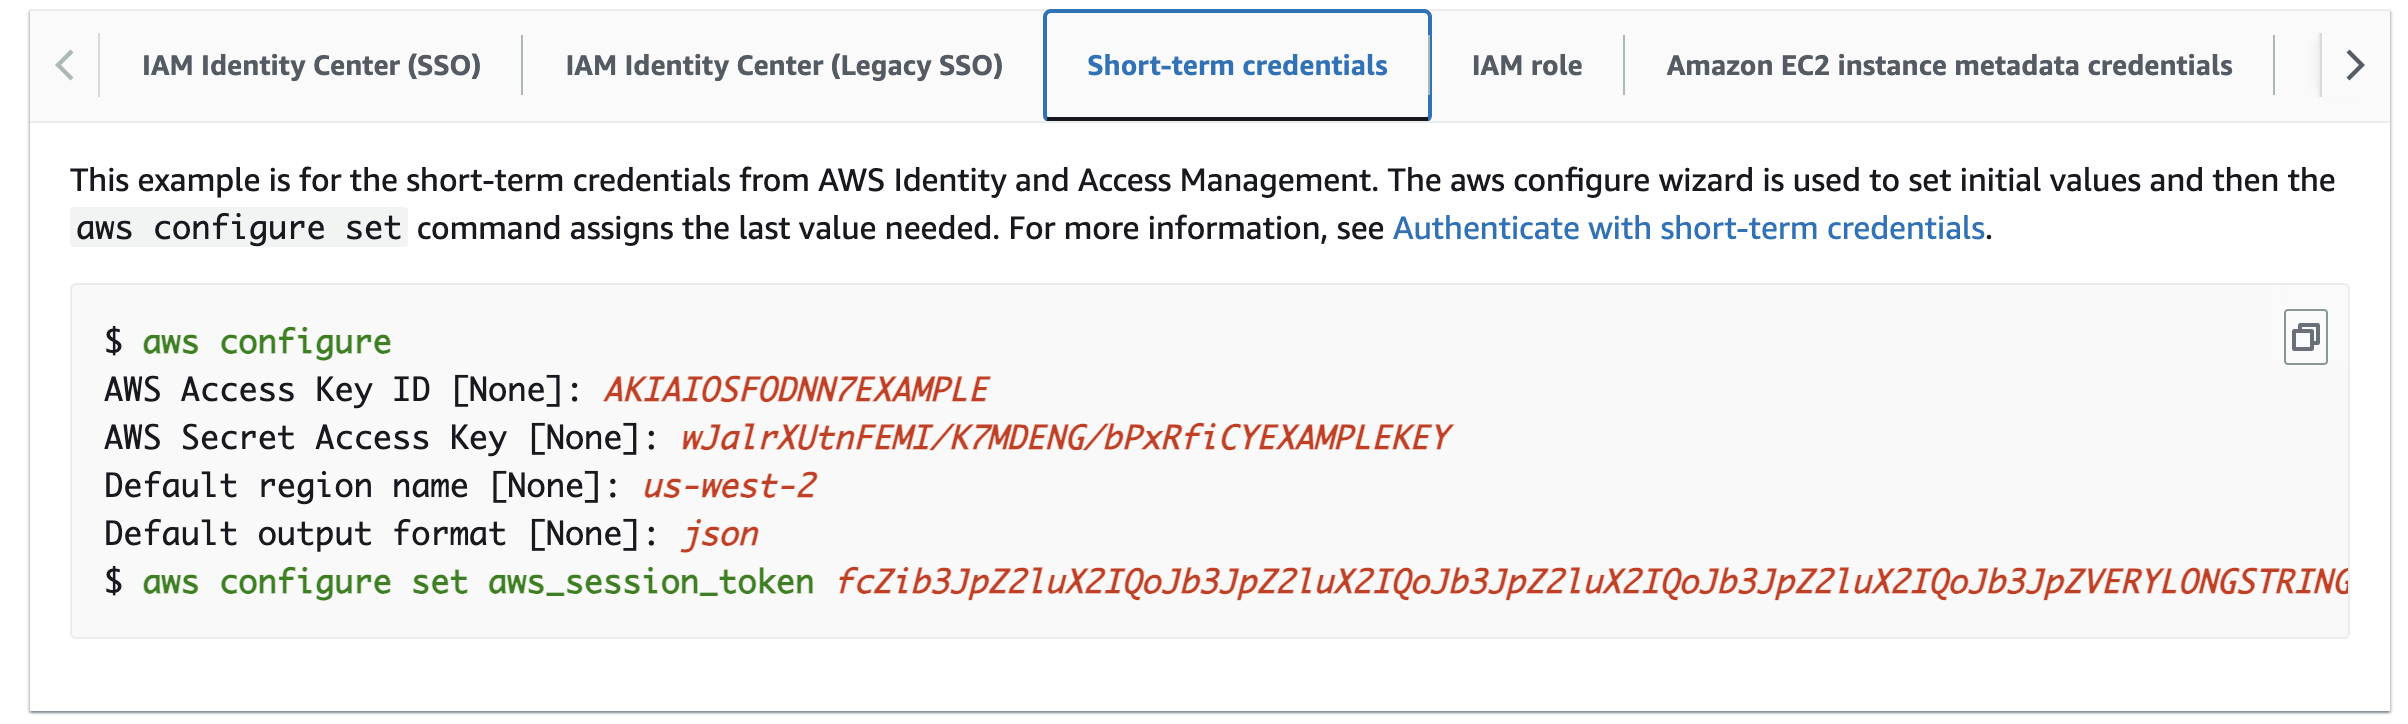
After configuration, you should be able to AWS CLI commands.
🐙 Check us out!
Clone the MDAI InkOps Toolkit
Visit our GitHub repo to access our MDAI InkOps Toolkit
git clone git@github.com:DecisiveAI/mdai-inkops.git
Navigate to the directory you just installed our toolkit.
# go to directory for the mdai-inkops toolkit
cd mdai-inkops
⏪ Back to: Configure AWS CLI Next Step: Configure AWS Env ⏩
Let's update your AWS Environment Configs
Navigate to the values/aws.env file and start inputting the environment configuration that's relevant to your AWS account and infrastructure configurations.
The AWS Basics
These fields are essential for AWS account access and resource control in AWS. These settings guarantee the MDAI Cluster will be installed in your desired account, region, and created with a user profile who has the correct permissions to create infrastructure. This is especially useful if these values differ from the default configurations in your AWS SSO/auth settings.
| Key | Example Value | Description |
|---|---|---|
AWS_REGION | us-east-1 | AWS Region to be used for MDAI cluster creation |
AWS_ACCOUNT | 123123456 | AWS Account to be used for MDAI cluster creation |
AWS_PROFILE | Admin-123123456 | AWS Profile to be used for MDAI cluster creation |
MDAI Cluster - Helpful Contexts
| Key | Example Value | Description |
|---|---|---|
MDAI_CLUSTER_NAME | my-mdai-cluster | A friendly name for your cluster |
READONLY: EC2 and EKS Configurations
These values should be considered READONLY.
The values can technically be changed, however this is the minimum required configuration for running the MDAI infrastructure with performance and cost in mind. You can adjust the values to fit your needs, note it's at your own risk. We have not tested beyond this configuration, but plan to in the near future.
| Key | READONLY Value | Description |
|---|---|---|
MDAI_EC2_INSTANCE_CLASS | t2 | EC2 Class used for nodes in the EKS cluster |
MDAI_EC2_INSTANCE_SIZE | micro | EC2 Size used for nodes in the EKS cluster |
MDAI_CLUSTER_CAPACITY | 12 | Number of cluster EC2 nodes |
Opt-in/out: MDAI Console UI Security
This is an opt-in/out feature that enables security via authentication on the Console UI app. By default your MDAI Console application will be exposed to the open internet for anyone to access.
Post-configuration, you will be presented with an option to configure more advanced authentication options in our AWS Authentication for your MDAI Console guide.
If you choose to remain opt'd-out ignore fields MDAI_UI_HOSTNAME and MDAI_UI_USER_POOL_DOMAIN.
| Key | Example Value | Description |
|---|---|---|
COGNITO | false (default) | Opt-in to include Cognito in your cluster infrastructure |
MDAI_UI_HOSTNAME | mdai.yourdomain.dev | A required field to map your MDAI Console UI URL to your custom domain via a CNAME record. This hostname will also be used during the SSL Cert creation for this flow. |
MDAI_UI_USER_POOL_DOMAIN | yourdomain | The domain name Cognito uses to bind your domain to, e.g., yourdomain.com would use yourdomain here. (https://yourdomain.auth.AWS_REGION.amazoncognito.com). This setting guarantees your domain will have a TLS (SSL) certificate auto-generated and auto-discovered during install. |
Should you choose to opt-in to Cognito, please be sure the
AWS_REGION you selected is part of the supported region.
Opt-in/out: Node AutoScaling
Default should be true if you're unsure if you want this, please change to false.
Karpenter provides dynamic and efficient scaling of your Kubernetes clusters. It automatically adjusts the number of nodes based on the current workload, ensuring optimal resource utilization and cost efficiency.
| Key | Example Value | Description |
|---|---|---|
KARPENTER | true (default) | An opt-in/out feature that enables autoscaling on the EC2 node sizes you have selected. |
If you opt-in to this feature, we handle the configuration under the hood for you. You can read more about this configuration in our Node AutoScaling Guide.
⏪ Back to: Check Us Out! Next Step: OTel config ⏩
⏲️ Time for OpenTelemetry! 📈
Let's update your MDAI Cluster's OTel configuration file.
🤔 You've got a couple options...
Option 1 - 👢 Bootstrap our built-in Collector Configuration
We have provided a default configuration for a simplified version of the OpenTelemetry collector at values/otelcol-config.yaml. Using our boilerplate can accelerate your deployment and configuration using OpenTelemetry.
MOARRR CHOICES!
You can...
- Use the config as is and update at your will later
- you can start making modifications right now
Learn more about the specifications for the OTEL Collector to make the best decisions for your telemetry pipelines configuration needs.
Option 2 - 🧳 Bring Your Own Configuration
Want to use a custom or tried-and-true OTel configuration file that already works for you?
Simply update the configuration file at templates/mdai-operator.yaml.
🔒 Securing your MDAI Cluster with Certs!
🙆♀️ Let's take a quick stretch break..
You might be feeling like this right now "🙄 ... more configs?!?"
😬 We know, we know.. so many options.
Trust us, we're truly here to help ease the pain of configuration and security for your MDAI Cluster. Hang with us, we're so close to done!
🙆🏽♂️ Okay.. one more stretch.. that's better.. back to it!
Step 1: Assigning SSL Certificates to your ingress endpoints
Option 1: 🚜 AutoGen a Cert
Let us help! We created a simple command that not only autogenerates a cert, it also uploads your cert to your AWS account based on your aws.env values you updated earlier.
make cert
🎉 CERT GENERATION COMPLETE! 🎉
There are no further steps for this option. You can move on to applying your configurations
Next Step: Applying configuration ⏩
Once you have access to your certificate in AWS ACM, it will be accessible via Amazon Resource Name (ARN). These ARNs need to be provided as a configuration parameter during the configuration phase, so make note of these ARNs. 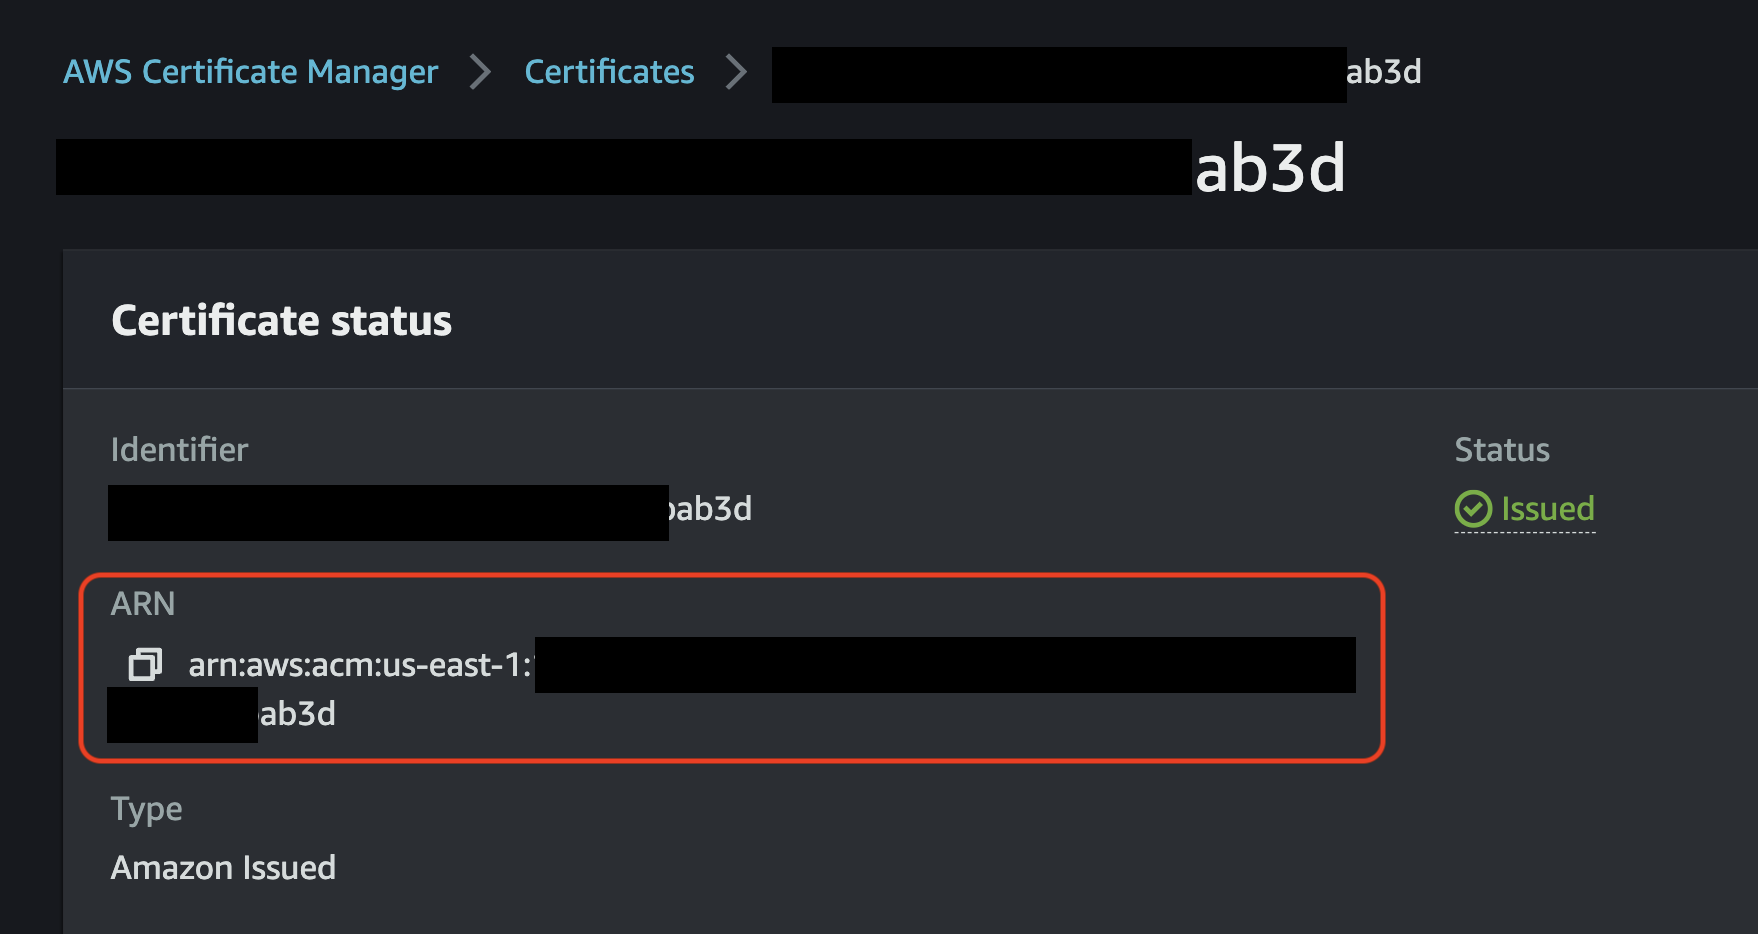
🚨 ‼️ NOTE: If you BYO cert, please copy the cern ARN after you import it to ACM! ‼️ 🚨
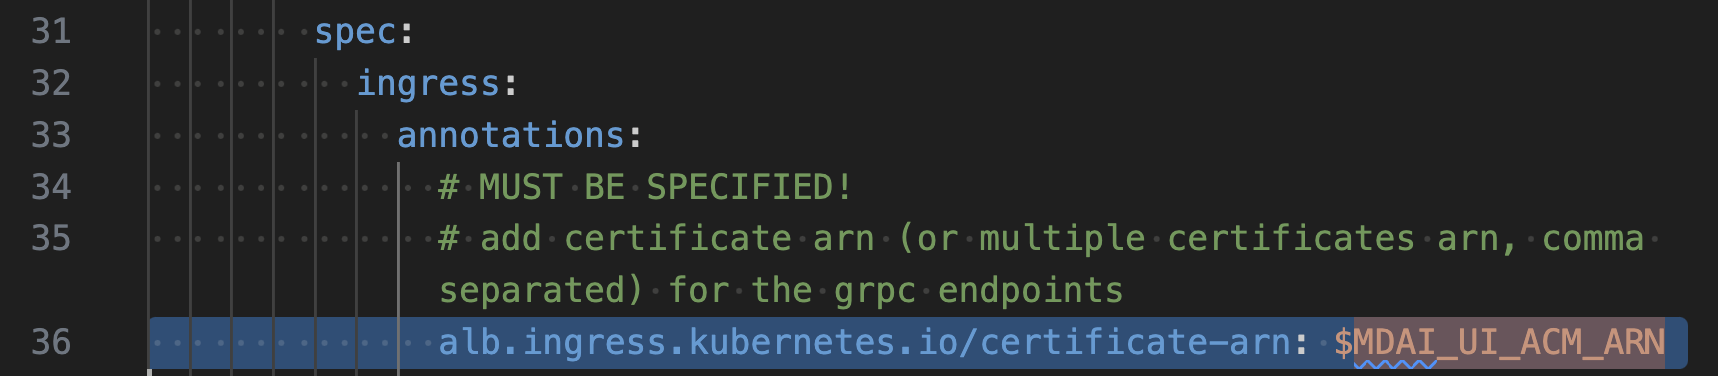
Manual step: Add Cert ARN to your OTel config
🪰 Remember that ARN we just pestered you about above? 🪰
Let's add it to the templates/mdai-operator.yaml file as the values for the following keys
service.beta.kubernetes.io/aws-load-balancer-ssl-cert
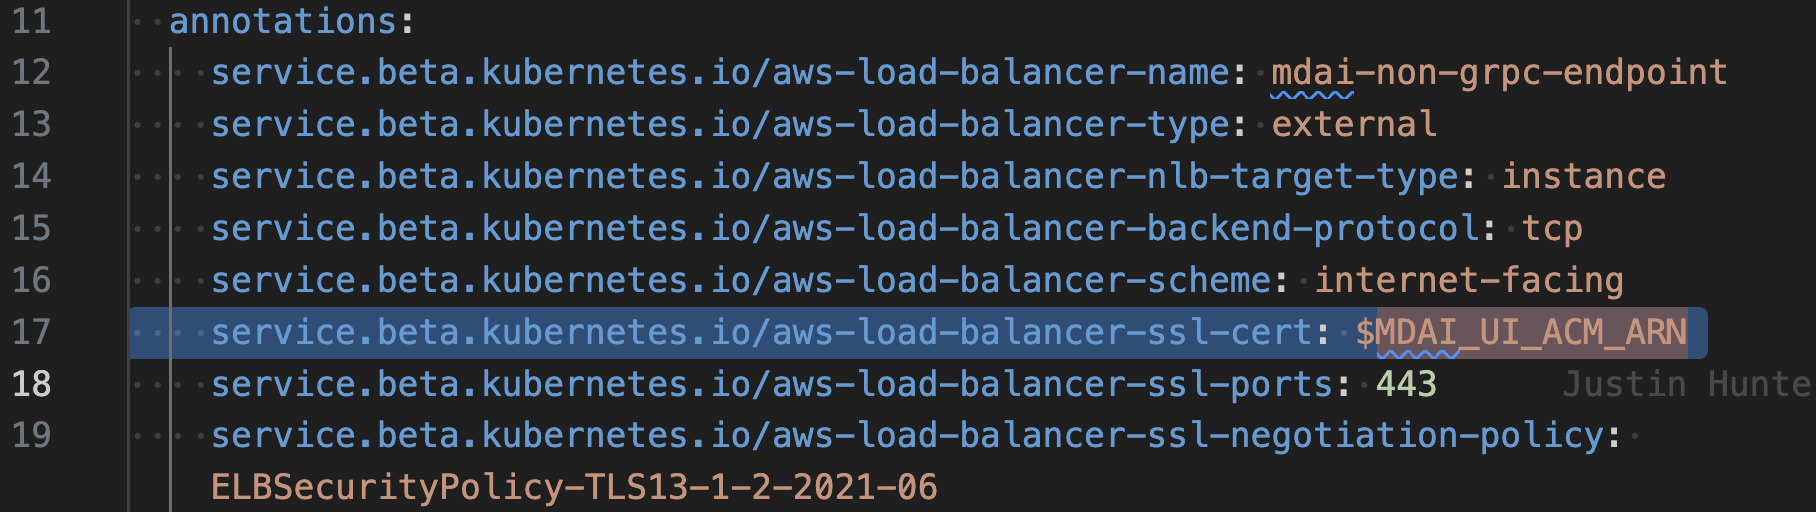
alb.ingress.kubernetes.io/certificate-arn
⏪ Back to: OTel Configuration Next Step: Applying configuration ⏩
🔧 Apply configuration to the MDAI Cluster
We're now going to run a configuration script to all those configs you've worked so hard on and apply them to a deployment script.
🐾 Go ahead.. do it.. I triple dog dare ya! 🐾
make config
🚀 It's time! Let's deploy 🚀
⏪ Back to: Adding Certs Next Step: Deploy your MDAI Cluster! ⏩
Deploying to AWS
🎶 Time for more theme music 🎶
💪 Congratulations! You're about to provision an MDAI Cluster! 💪
We hope to have benchmarks soon for cost and performance of our MDAI Clusters.
Deploy the MDAI Cluster
make install
There's one more manual verification step required before CloudFormation will deploy all necessary infrastructure to get your MDAI Cluster up and running as soon as possible.
The install workflow
-
The install will check and bootstrap the CDK Toolkit if it's not present for your configured region.
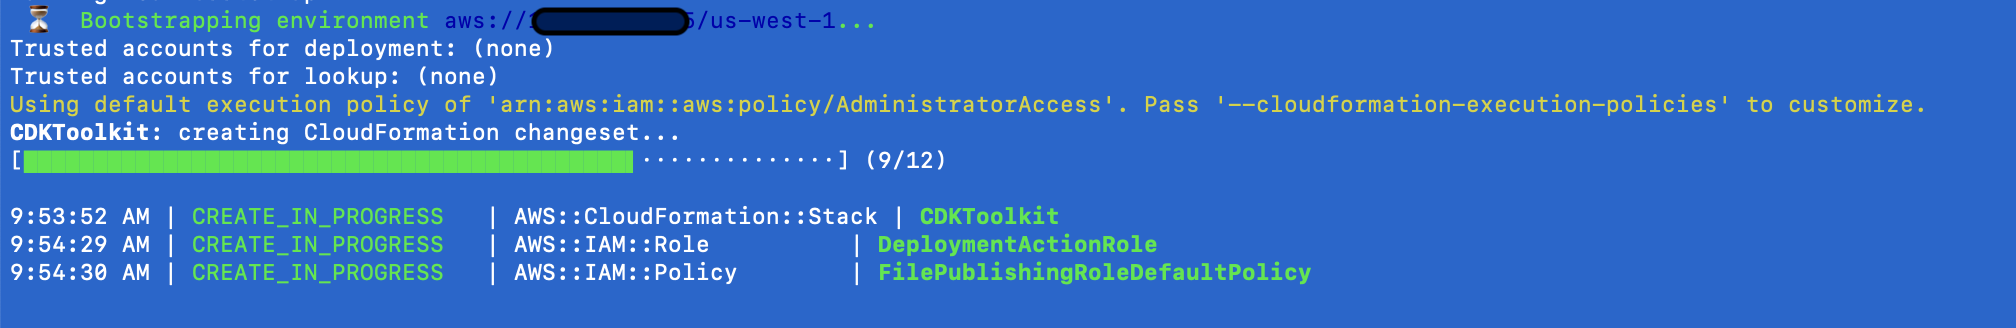
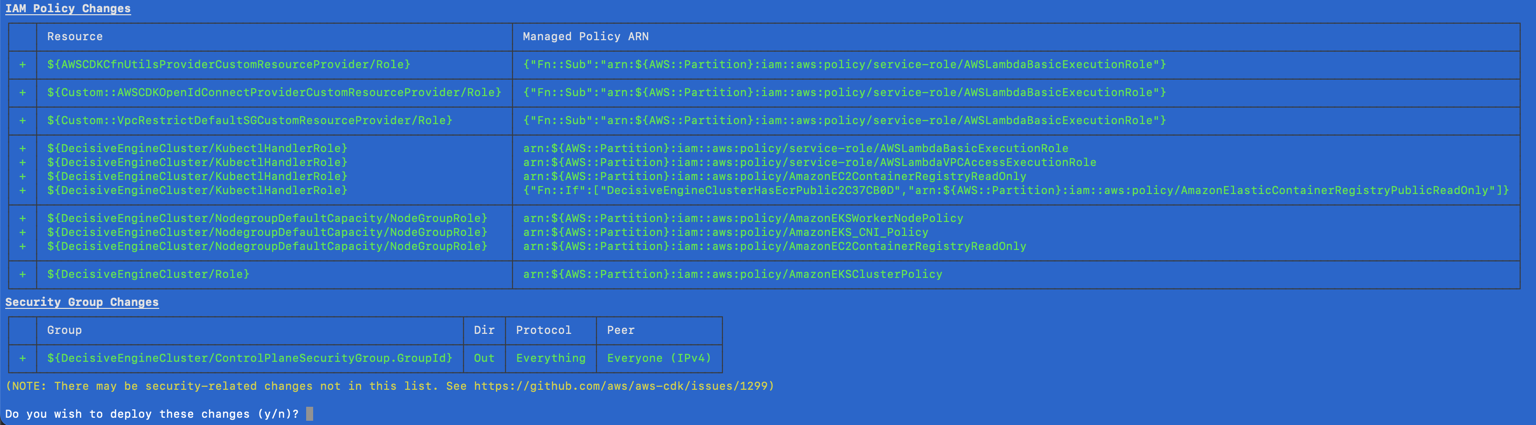
-
The CDK will output the detected changes and ask you to accept or reject the changes. Review all output carefully before proceeding!
-
Follow the progress of the stack deployment process through the terminal interface.
or AWS Console -> Cloud Formation
-
The installation process will add a new context to your
kubeconfig. You can switch context by running:kubectl config use-context <desired_context>Detailed output will be stored intocdk-output.json.
A few notes while your stack is being provisioned...
-
🍿 Grab some popcorn! 🍿 Average install time is ~20-30 minutes.
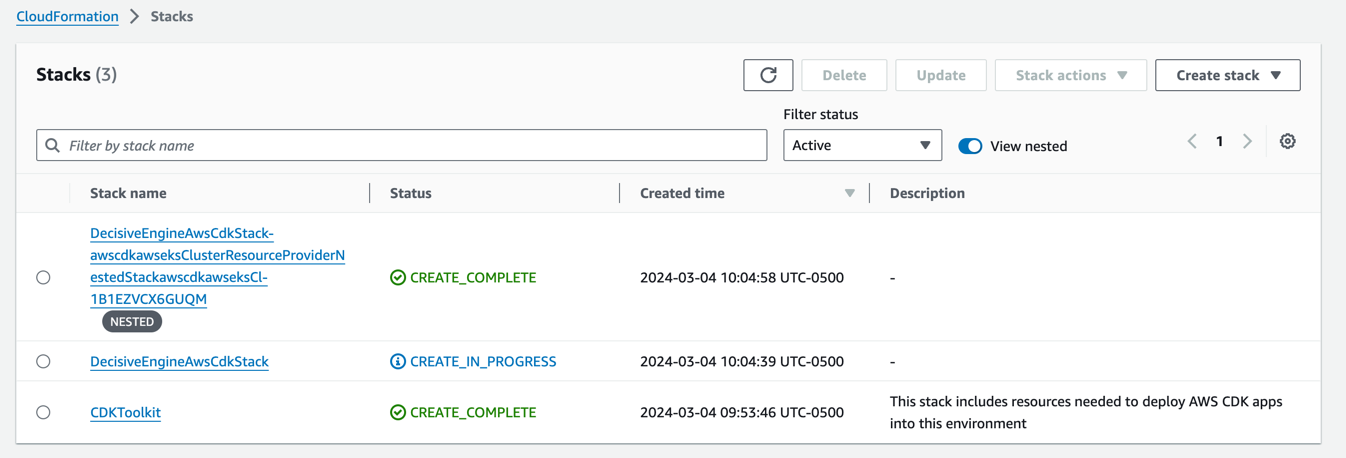
-
👀 Don't want to monitor your terminal? Check out your stack's provisioning status in the AWS Console.
<!-- Change AWS_REGION to the region you deployed to -->
https://AWS_REGION.console.aws.amazon.com/cloudformation/home?region=AWS_REGION#/stacks?filteringText=&filteringStatus=active&viewNested=true
- 🏛️ View your stack's architecture in the CloudFormation Designer tool.
To find your stack ARN:
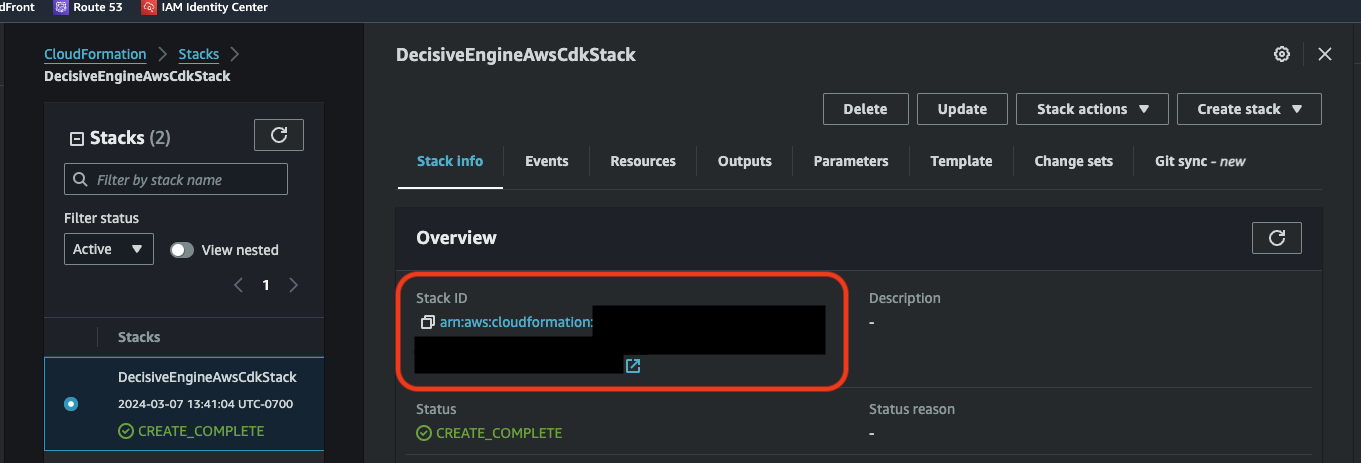
<!-- Change AWS_REGION to the region you deployed to -->
<!-- Change STACK_ARN to your stack's ARN -- shown above  -->
https://AWS_REGION.console.aws.amazon.com/cloudformation/designer/home?region=AWS_REGION&stackId=<STACK_ARN>#
Want to see how the MDAI Cluster runs locally?
🛠️ Build a local version while you're waiting! QuickStart
⏪ Back to: Configure Your MDAI Cluster Next Step: Verify Installation ⏩
Verify installation
Verify the MDAI Cluster via kubectl
Ensure your cluster is up and running.
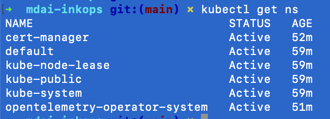
Verify namespaces
List out all namespaces
kubectl get ns
Expected output
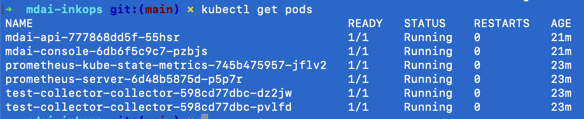
Verify pods
List out all pods in the default namespace.
kubectl get pods
Expected output
Your output for default configuration should be similar to:
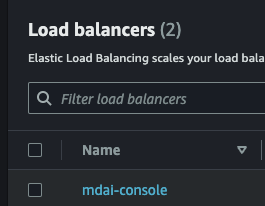
Verify the Console is up and running
Step 1: Navigate to your AWS EC2 Load Balancer in the AWS Console
Note: Replace
AWS_REGIONwith the region you deployed to.
https://AWS_REGION.console.aws.amazon.com/ec2/home?region=AWS_REGION#LoadBalancers
Step 2: Find the LB where the name is mdai-console
Step 3: Copy DNS Name from mdai-console LB
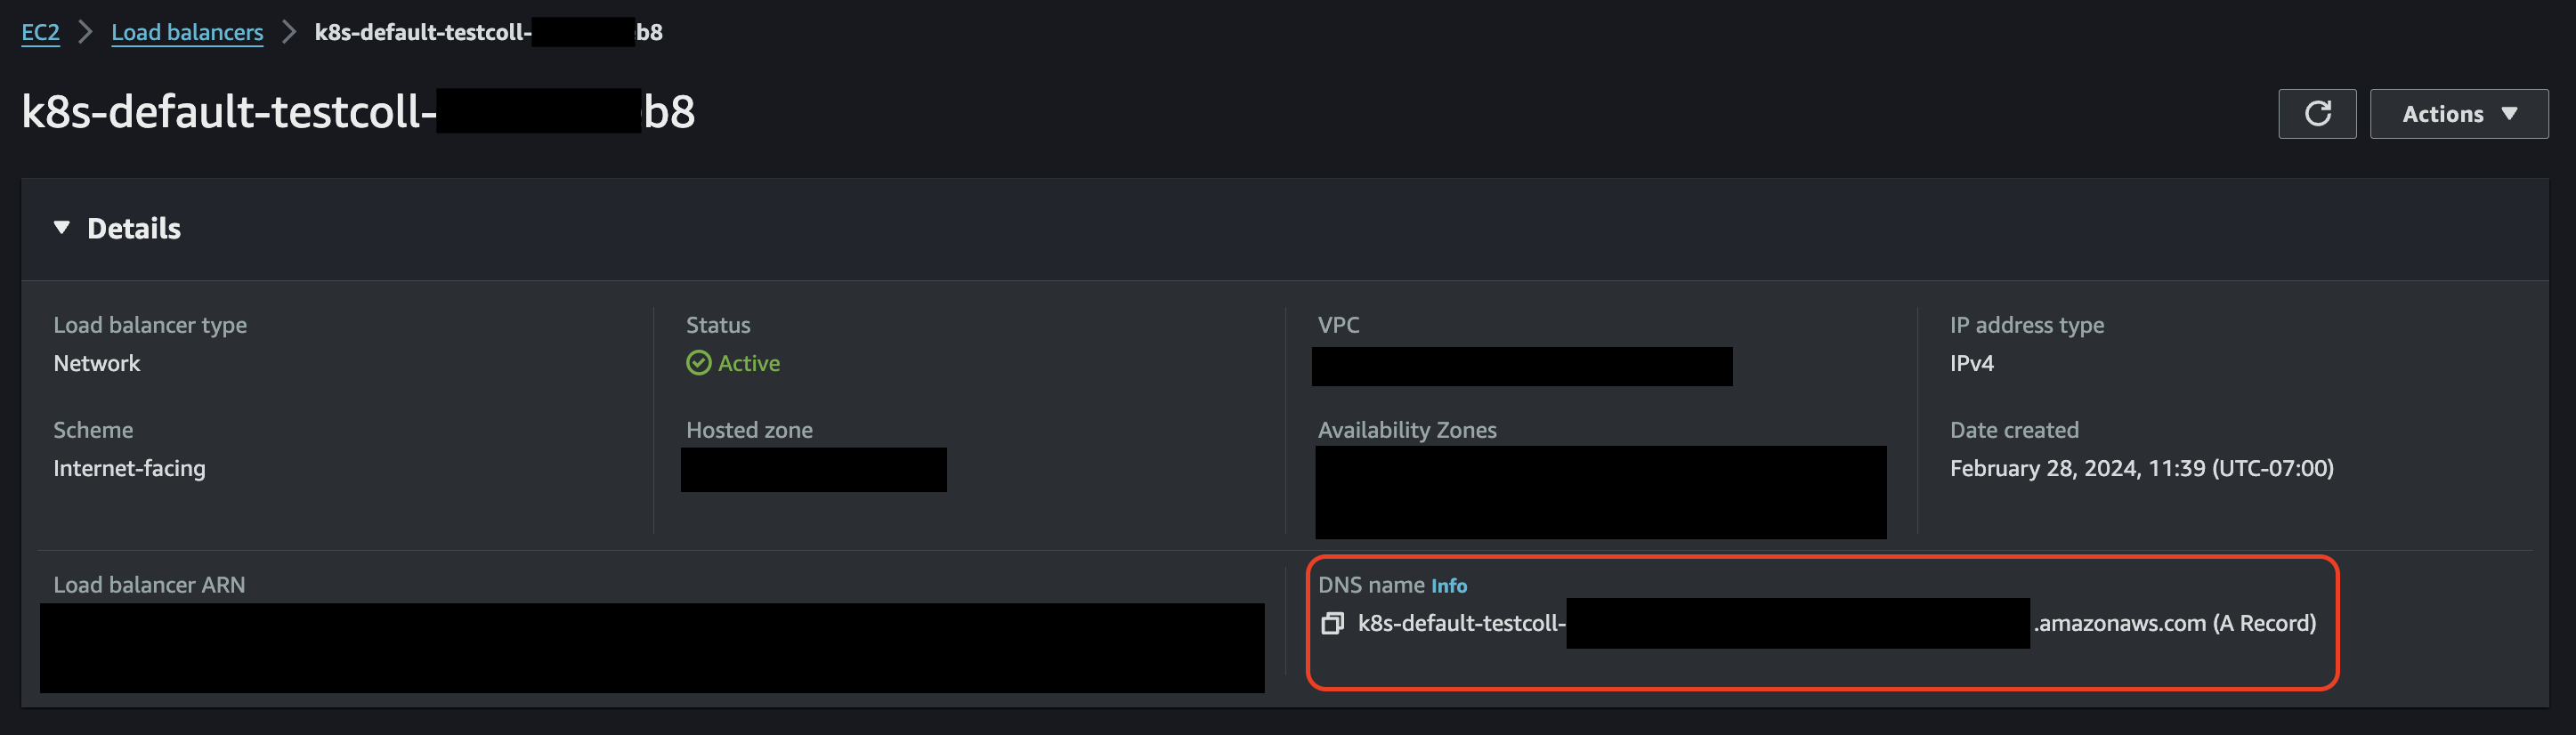
OPTIONAL: Use CNAME Record for Console Access
If you'd prefer to use a custom domain to access your MDAI Console (e.g., your-console.yourdomain.com), you can copy the Console Load Balancer Endpoint and create a CNAME record for you host provider (e.g., GoDaddy).
Once updated, you'll need to wait for the DNS mapping to resolve.
You may also need to add an SSL Cert to create a secure connection to your app using this mechanism.
Step 4: Navigate to the URL and view the console

⏪ Back to: Deploy Next Step: Validate ⏩
Validate data flow
- From the last step in Verify, you should've found your Console UI Load Balance link. Please visit that URL to view your pipeline configuration and dataflow.
- As telemetry flows through the MDAI Cluster, you will see counts increase in the console, color-coded by telemetry type. 🐙🎉
Note: Data flowing to
debugexporters are not counted towards data flow totals in the right sidebar
⏪ Back to: Verify Next Step: UI Auth Options ⏩
Options for AWS Authentication for your MDAI Console
This documentation outlines how to configure AWS access for the MDAI Console. We will cover three scenarios:
🌐 Public access (no authentication)
[Pre-Installation] - Fastest, least secure
Note: You should've already explored this option pre-install.
You just need to spin this darn cluster up and don't mind your Console being open to any user on the internet.
🔒 Cognito
[Post-Installation] - Secure, slightly complex
AWS Cognito provides a scalable and secure authentication mechanism for your application. You get a login interface and can connect it to your custom domain.
🥷 VPC-based access
[Post-Installation] - Most secure, most complex
This is the most secure option as you have the most control over inbound traffic/access to the cluster.
Choose your adventure...
Please select from the options above you'd like to use for auth for your MDAI Console.
🌐 Public access (no authentication)
🔒 Cognito
🌐 Public access (no authentication)
Long hair, don't care? Just want to test us out without auth on your Console? NO PROBLEM!
During setup you have the option to opt-out of the default Cognito-based auth solution by setting your flag to COGNITO=false in the aws.env file. This will prevent any auth-related resources from being installed in your infrastructure in the future.
# An opt-in/out feature that enables auth on the Console UI app.
# Default should be true if you're unsure if you want this, please change to false.
# If you select false, ignore fields MDAI_UI_HOSTNAME and MDAI_UI_USER_POOL_DOMAIN
COGNITO=true

# Amazon Resource Name (ARN) of the certificate to be used for the Console endpoint (e.g., eu-west-2.yourdomain.dev)
MDAI_UI_HOSTNAME=

# The domain name to tie your auth to, e.g., 'example.com' would use 'example' here (e.g., yourdomain)
MDAI_UI_USER_POOL_DOMAIN=
Some bad news...
Currently, we don't have steps to retroactively apply cognito if you change your mind, but with your feedback to support@mydecisive.ai or by opening an issue, we'll prioritize these post-install flows for you!
⏪ Back to: Validate Installation Next Step: Lifecycle Overview ⏩
🔒 Cognito
We knew it wouldn't be acceptable to leave your precious new resources unprotected and open to any user of the internet!
...Enter Cognito...
We've added the ability to connect Amazon Cognito easily to your new MDAI Cluster to limit access for undesired users.
Failed deploy model due to failed to create listener rule: ValidationError: Action type 'authenticate-cognito' must be one of 'redirect,fixed-response,forward,authenticate-oidc' status code: 400, request id: ########-####-####-####-############
The above error can be found in the AWS Console > EKS service.
You can access the ingress output manually:
EKS > Clusters > [YOUR_CLUSTER] > Resources > Service and networking > Ingresses > ui-alb-ingress
You can access the ingress output by hitting this link after updating the values in brackets:
https://[AWS_REGION].console.aws.amazon.com/eks/home?region=[AWS_REGION]#/clusters/[YOUR_CLUSTER]/ingresses/ui-alb-ingress?namespace=default
Our installation includes the following resources upon creating an MDAI Cluster:
- User pool
mdai-user-pool - App client
mdai-app-client
⚙️ Pre-built configuration
The following environment variables need to be defined in values/aws.env during the pre-build configuration step:
MDAI_UI_HOSTNAME
This is a hostname for the UI endpoint, which is going to be used as a main UI hostname. This should directly relate to a DNS CNAME record, pointing to DNS hostname, generated by AWS for the Load Blancer mdai-console endpoint.
MDAI_UI_USER_POOL_DOMAIN
This variable contains a prefix for User pool domain.
Amazon Cognito domain
is used with this installation, so this variable represents a prefix, for the domain.
This domain name will become a part of the auth redirecting URL.
🧍User(s) creation
The only manual step required is a user(s) creation.
Option 1: Via the AWS Console UI
Please follow the Amazon Cognito User Pool documentation steps
to create users(s) in mdai-user-pool.
Option 1: Via the AWS CLI
If you prefer to use the command line, this quick command will find the user group created as a result of the MDAI stack and perform the user create operations.
for up_id in $(aws cognito-idp list-user-pools --max-results 1  --region <your-region> --profile <your-profile> --query 'UserPools[?Name==`mdai-user-pool`].[Id]' --output text); do
    echo "Creaded user ${up_id}"
    aws cognito-idp admin-create-user --user-pool-id $up_id --username user@yourdomain.com --temporary-password P@55w0rd_fun --region <your-region> --profile <your-profile>
done
⏪ Back to: Validate Installation Next Step: Lifecycle Overview ⏩
🥷 VPC Access
For secure access within a VPC, ensure your Kubernetes cluster and app are configured to operate within the VPC.
Configuring VPC for EKS
1. Create EKS Cluster within VPC
During install you should have created an EKS cluster. You should be able to find your cluster name and region in the aws.env file used for cluster installation. You can use the following link to navigate to your cluster Networking settings and view the relevant subnets.
https://<your-region>.console.aws.amazon.com/eks/home?region=<your-region>#/clusters/<your-cluster-name>?selectedTab=cluster-networking-tab
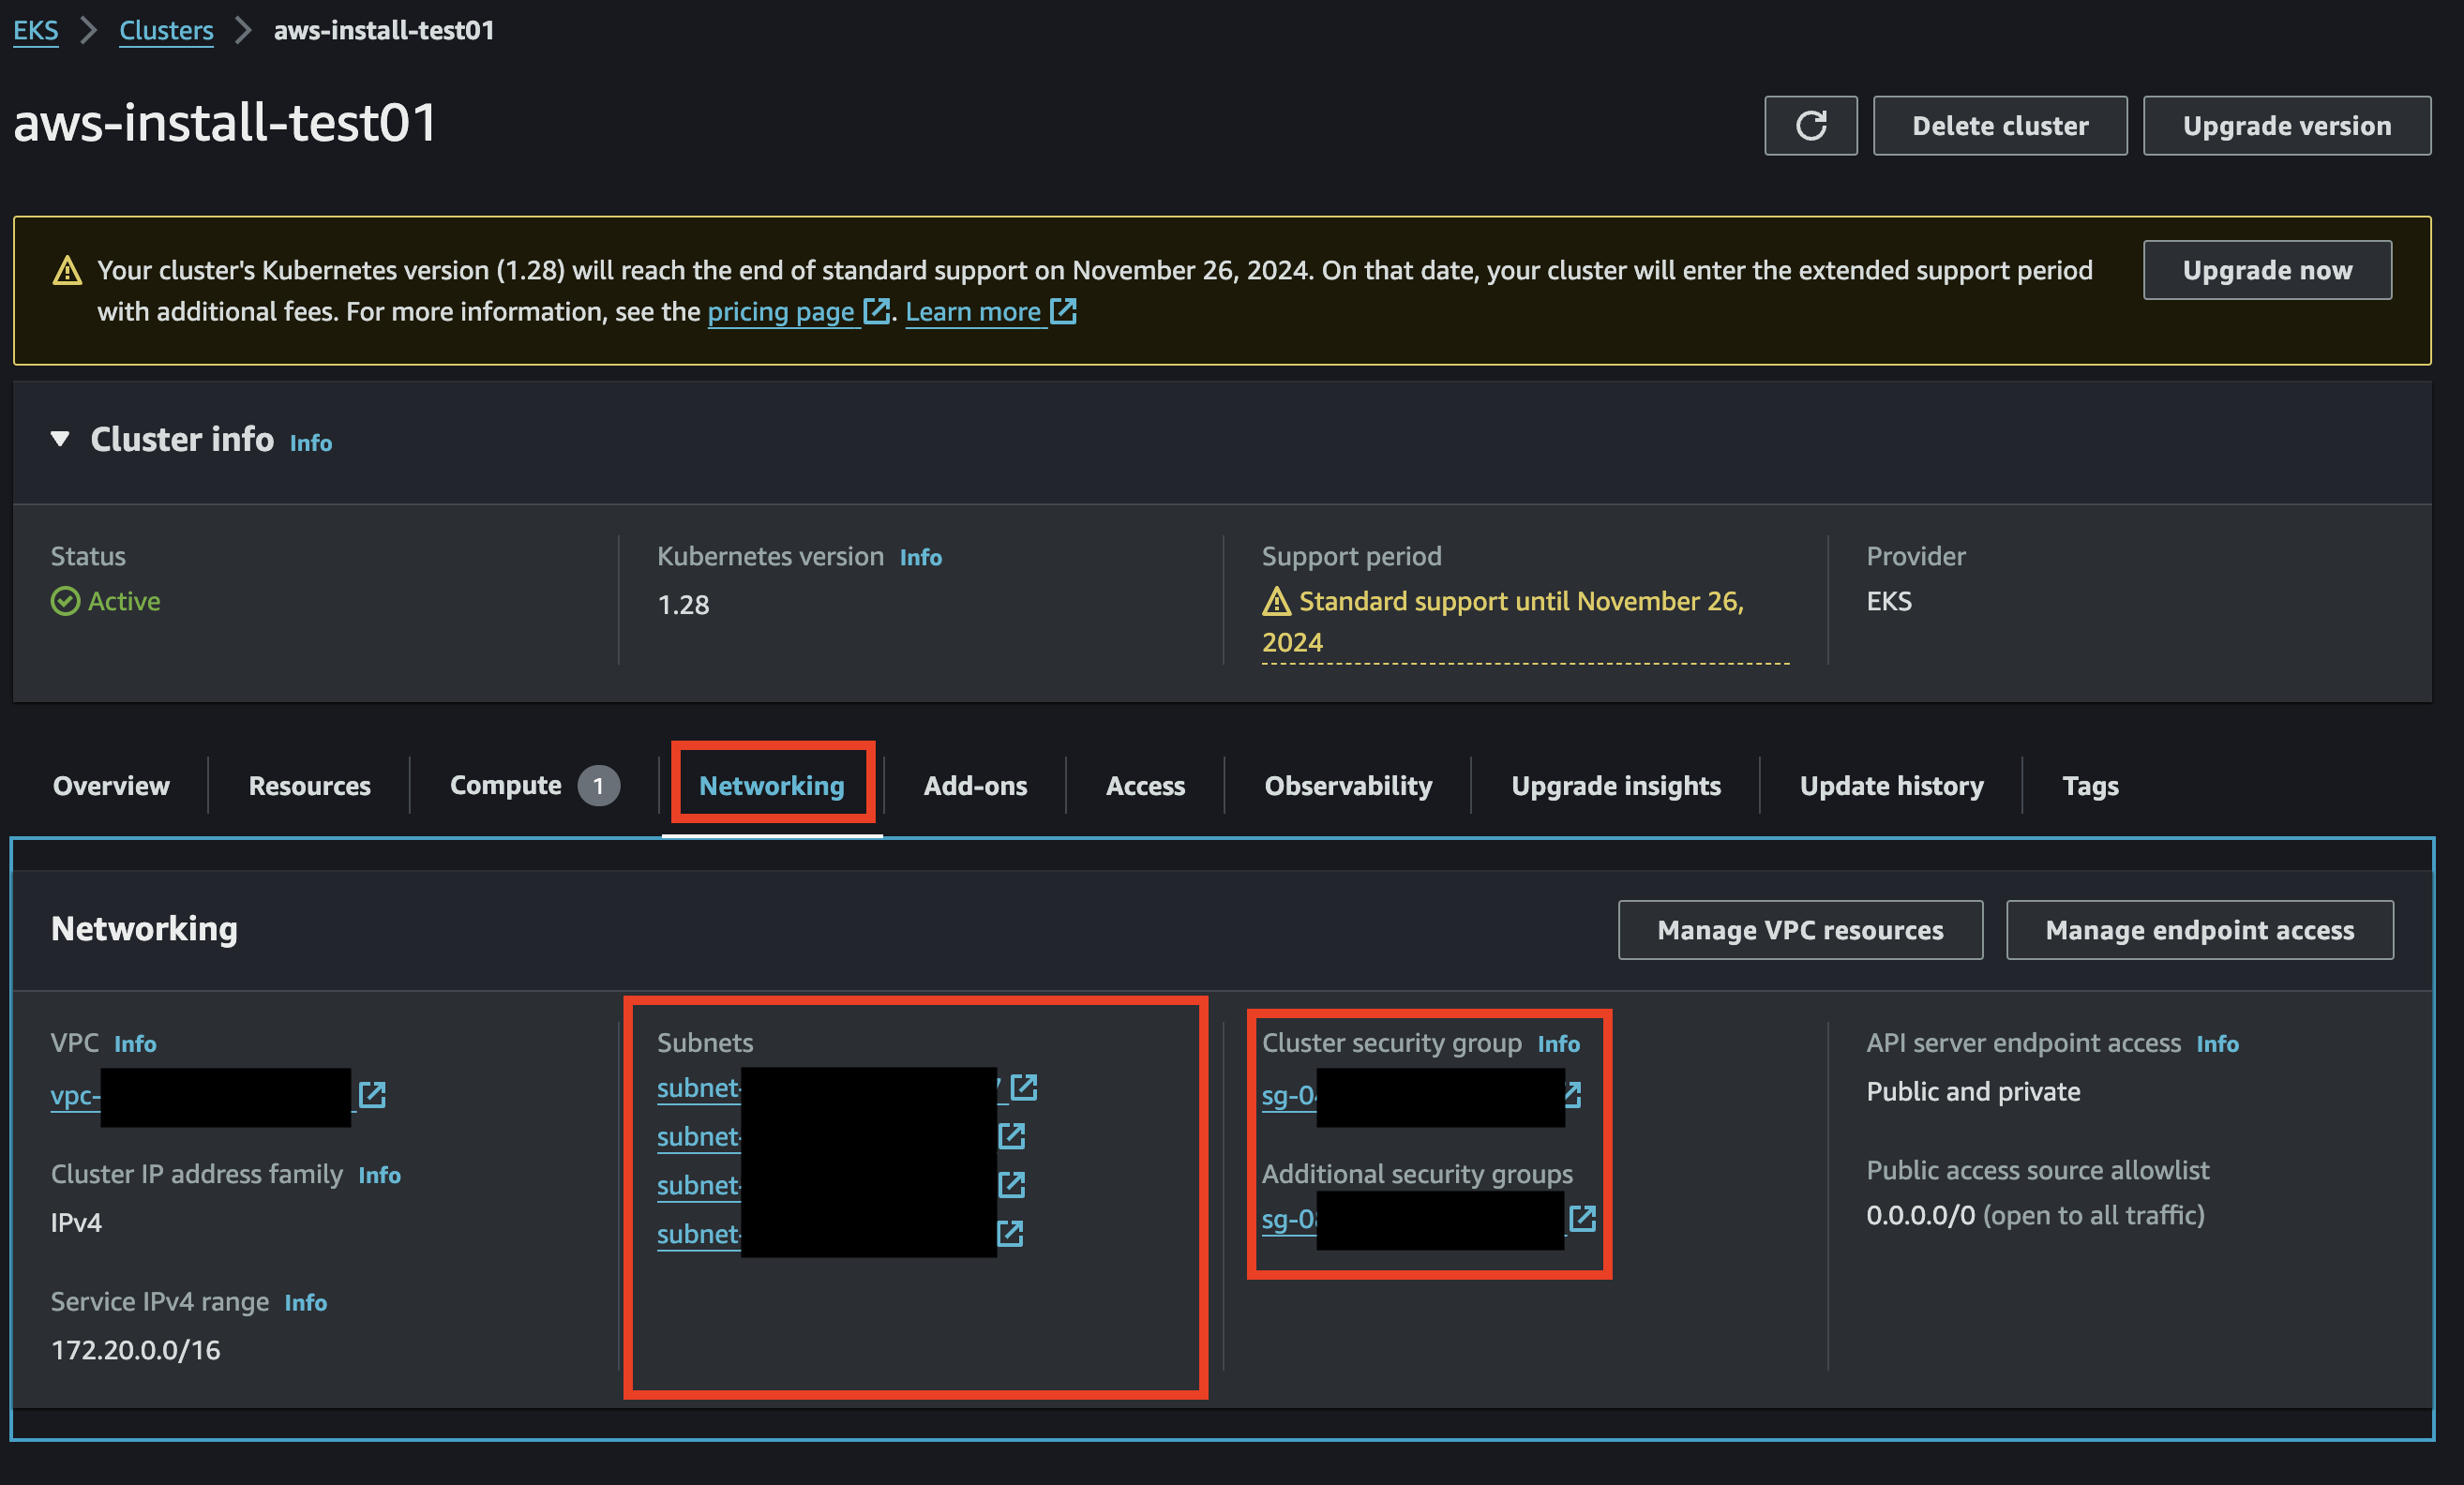
Note the subnets and security groups are created for you.
2. Configure Security Groups
Setup the correct security group rules for your desired security.
VPC Peering (if necessary):
If the app needs to communicate with resources in another VPC, you might consider
- Setting up VPC peering
- Setting up route tables
⏪ Back to: Validate Installation Next Step: Lifecycle Overview ⏩
MDAI Cluster Life Cycle Management
Overview
MDAI Cluster lifecycle management involves post-creation operations to control the behavior and state of the components of each MDAI Cluster or the MDAI Cluster as a whole.
The common use cases for lifecycle management are highlighted below...
- Disable MDAI Cluster Ingress - Disable ingress to validate that data flow has stopped.
- Enable MDAI Cluster Ingress - Enable ingress to validate that data flow has been re-instantiated.
- Destroy MDAI Cluster - Destroy all artifacts associated with the MDAI Cluster.
🚨 Important considerations for Life Cycle Management 🚨
- Ensure that you have the necessary permissions and access rights to perform these operations.
- Always review and test configurations before applying changes to avoid unintended consequences.
- Use caution when destroying a cluster, as it will permanently delete all associated resources.
Disable MDAI Cluster Ingress
You may need to temporarily halt incoming traffic to perform maintenance or troubleshoot issues without impacting data flow.
How to Disable
Manual
- Set replica count to
0invalues/params-values-otel.yaml:
spec:
  # 2 replicas recommended
  replicas: 0
- Apply config to cluster
kubectl apply -f values/params-values-otel.yaml
⏪ Back to: UI Auth (Cognito) Next Step: Enable MDAI Cluster ⏩
Enable MDAI Cluster Ingress
After completing any tasks related to disabling your MDAI Cluster instance (i.e., maintenance or MDAI Cluster data flow resolution), you likely want to resume ingress and ensure that data flow resumes smoothly.
How to Enable...
Manual
- Set replica count to
2invalues/params-values-otel.yaml:
spec:
  # 2 replicas recommended
  replicas: 2
- Apply config to cluster
kubectl apply -f values/params-values-otel.yaml
Automated
Check back soon, we're working on an automated flow for disabling your MDAI Cluster.
⏪ Back to: Disable MDAI Cluster Next Step: Destroy MDAI Cluster ⏩
Uninstall the MDAI Cluster
Tired of using the MDAI Cluster? 😭 We're sorry to see you go, but we understand.
Feedback - Where are the rough edges?
We'd love to hear your thoughts! Please let us know how we can improve by:
- Filling our Feedback form
- Emailing us Feedback to our Support Team
🧨 Time to destroy
Due to AWS CDK limitations several additional steps required to fully remove all MDAI Cluster resources from AWS. Follow the steps below, in order, to destroy your MDAI Cluster and all associated resources.
Remove the helm chart for the console
helm uninstall mdai-console
Scripts for destroying MDAI Cluster stack
Step 1: Allow scripts to be executed
You may need to give access to the destroy scripts if you don't have permissions to execute them
chmod +x ./make/scripts/delete-load-balancers.sh
chmod +x ./make/scripts/delete-stack.sh
chmod +x ./make/scripts/delete-network-artifacts.sh
Step 2: Ensure you have your env variable available
Upon MDAI Cluster creation you should have a .env file full of variables. It will look something like the example below, but with values populated.
MDAI_UI_ACM_ARN=
AWS_REGION=
AWS_ACCOUNT=
AWS_PROFILE=
MDAI_EC2_INSTANCE_CLASS=
MDAI_EC2_INSTANCE_SIZE=
MDAI_CLUSTER_CAPACITY=
MDAI_CLUSTER_NAME=
COGNITO=
MDAI_UI_HOSTNAME=
MDAI_UI_USER_POOL_DOMAIN=
AWS_SSO_ROLE=
Step 3: Delete all your load balancers
This step is instantaneous and you shouldn't have to wait at all for changes to take effect.
./make/scripts/delete-load-balancers.sh
Step 4: Delete your stack
Grab your popcorn! 🍿 This step takes anywhere from 15-20 minutes as you'll be deleting all the artifacts related to the cluster from installation.
# Delete the stack
./make/scripts/delete-stack.sh
You should be able to following the delete progress in one of two ways...
- Via the AWS Console UI (replace
AWS_REGIONwith your desired region)
https://AWS_REGION.console.aws.amazon.com/cloudformation/home?region=AWS_REGION#/stacks?filteringText=&filteringStatus=active&viewNested=true
- Via the CLI
aws cloudformation describe-stacks \
    --stack-name "$STACK_NAME" \
    --region "$REGION" \
    --profile "$PROFILE" \
    --query "Stacks[0].StackStatus" \
    --output text
🎵 Here's some mood music while you wait. 🎵
Step 5: Delete network artifacts
One of the main reasons your stack fails in the networking layer of your cluster. This script should help delete the artifacts and resources related to networking.
./make/scripts/delete-network-artifacs.sh
Step 6: Force delete the stack
./make/scripts/force-delete-stacks.sh
Step 7: Run the destroy process again via AWS Console UI
If all else fails, you should be able to visit your Stack url in the AWS Console UI and retry delete with the force delete option.
⏪ Back to: Enable MDAI Cluster ⏩ Next Step: Generate Telemetry ⏩
Intro: Generate and Receive Telemetry
What kind of user are you?
TelemetryGen
I don't have any existing agents/collectors that I can use to send telemetry right now.
Postman & mock MLT payloads
I want to send some payloads using Postman to my MDAI Cluster!
curl or grpcurl & mock MLT payloads
I want to use my terminal to send some payloads using Postman to my MDAI Cluster!
Real Collectors, Real pipelines
I have existing sources of telemetry I'd love to point to my new MDAI Cluster!
Setup your collectors with OTel pipelines now!
⏪ Back to Installation Next Step: TelemetryGen ⏩
Using TelemetryGen to send data to MDAI Cluster
Why use TelemetryGen?
Using TelemetryGen is a great option if you're not ready to commit to the costs associated with ingress/egress to your cluster. It's all local to the cluster you have just deployed, so there will not be additional charges, minus the compute required to generate and process the telemetry.
Let's begin!
In our example we'll
- Create or use an existing cronjob or job
- Apply the cronjob/job to your cluster
- Watch telemetry flow through the console
- Destroy the cronjob/job
- Eat cake!
Step 1 - Create or use cronjobs
You can create a CronJob (or use one from the /jobs directory).
Step 2 - Apply the cronjob to your cluster
kubectl apply -f <cron_filename.yaml>
Step 3 - Validate job is running
Via kubectl
# Get job by name - replace job-name with your cronjob's name
kubectl get cronjob job-name

# Still not enough? Watch your cronjob using the --watch command
kubectl get cronjob --watch
At this point, you should also be able to see data flowing through the MDAI Console to validate data flow.
Step 4 (optional, recommended) - Delete the cronjob once testing is complete
# Delete job by name - replace job-name with your cronjob's name
kubectl delete cronjob job-name
Step 5 - Eat cake 🍰!
You sent your first telemetry record to MDAI!
🎉 That's it! Your MDAI Cluster is now ready to use! 🎉
Want more ways to send your cluster data?
Still curious about the other ways to generate and send telemetry?
- Send sample data with Postman
- Send sample data via terminal
- Setup your collectors with live agents/collectors
⏪ Back to Intro: Generate and Receive Telemetry
Using curl or grpcurl to send data to MDAI Cluster
⚠️ Note: These docs assume you have already installed an MDAI Cluster! ⚠️
Finding and setting HTTP_HOST and GRPC_HOST
Not sure where to get the variables for GRPC_HOST and HTTP_HOST?
- I need my Cloud env. variables Get them now!
- I need my Local env. variables Get them now!
Cloud
GRPC_HOST & GRPC PORT
You can find your GRPC_HOST value by running:
kubectl get ingress -n default
Your output should look something like this...

For gateway_ingress, note the HOSTS value. This will be used for your GRPC_HOST
Your GRPC_PORT will always be :443, as this is the secure listener for your gRPC endpoint.
You can also make note of the mdai-console-ingress, ADDRESS value to validate requests sent from postman later.
HTTP_HOST & HTTP_PORT
You can find your HTTP_HOST value by running:
kubectl get svc gateway-collector -n default
Your output should look something like this...

For the gateway_collector service, note the EXTERNAL-IP value. This will be used for your HTTP_HOST
Your HTTP_PORT will always be :4318, as this is the secure listener for your http endpoint.
Local
For Local testing your GRPC_HOST and HTTP_HOST will always be localhost.
Port-forward your ingress endpoints
The ports, however, will need to be forwarded to their respective testing ports. Luckily there are two pods created during cluster install. You should be able to forward each of them to retrieve requests, one for http and another to gRPC requets.
kubectl get pod
Your output should look like...
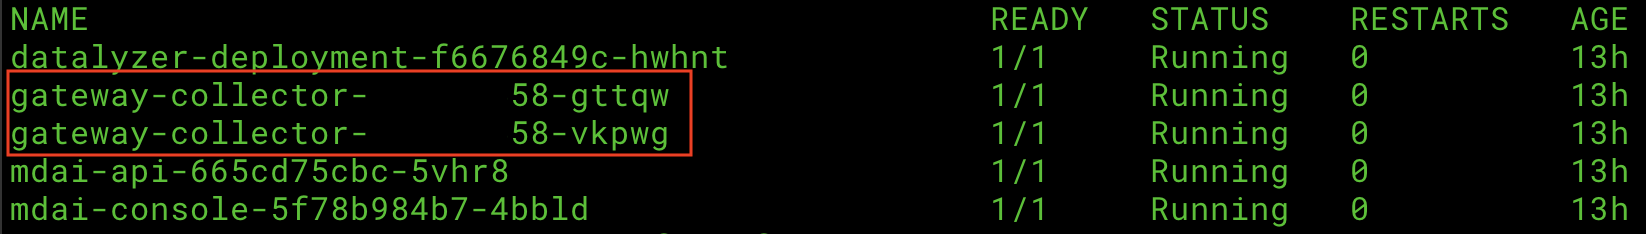
Make note of your gateway-collector pod names. For simplicity we will use the ports:
4713for gRPC requests4813for http requests
GRPC_PORT=4317
HTTP_PORT=4318
Now let's forward those ports!
# Example port-forward request
kubectl port-forward <POD_NAME> <PORT>:<PORT>

# gRPC Example

kubectl port-forward gateway-collector-abcd123-xyz1 4318:4318

# HTTP Example

kubectl port-forward gateway-collector-abcd123-1zyx 4317:4317
Set the *_OTLP_ENDPOINT variables in your terminal
HTTP_HOST=<ENTER THIS USING THE OUTCOME FROM ABOVE STEPS>
HTTP_PORT=<ENTER THIS USING THE OUTCOME FROM ABOVE STEPS>
GRPC_HOST=<ENTER THIS USING THE OUTCOME FROM ABOVE STEPS>
GRPC_PORT=<ENTER THIS USING THE OUTCOME FROM ABOVE STEPS>
GRPC_OTLP_ENDPOINT="$GRPC_HOST:$GRPC_PORT"
HTTP_OTLP_ENDPOINT="$HTTP_HOST:$HTTP_PORT"
Start firing off requests
Sending a curl
Send a curl request to the collector (e.g. for Logs):
# execute the request using the data from the example log data file
curl -X POST -H "Content-Type: application/json" -d @./examples/http_service/logs.json -i http://${HTTP_OTLP_ENDPOINT}/v1/logs
Sending a grpcurl
Pre-req Install grpcurl
Install grpcurl using your preferred method in the grpcurl Installation Guide
or
Via homebrew
brew install grpcurl
Send a request
/examples directory from the InkOps repo, and run this command from that location on your machine. You may need to change the path if you copy the `/example` directory to your machine.
# use data from ./examples/grpc_service/logs.json AND
# run the request using the data (as stdin) copied from above
```shell
cat ./examples/grpc_service/logs.json |
grpcurl -vv -insecure \
    -d @ \
    -proto examples/protos/opentelemetry/proto/collector/logs/v1/logs_service.proto \
    -import-path examples/protos \
    $GRPC_OTLP_ENDPOINT \
    opentelemetry.proto.collector.logs.v1.LogsService/Export
Note: Remember to change the Service path and Service Namespace when sending other signals (traces/metrics).
Feedback
Are you experiencing issues or would like to submit a request to our team?
- Email us at support@mydecisive.ai
- File an issue under the MDAI Postman
Coming from Local Install?
⏪ Back to Sending Data to MDAI Want to validate telemetry data flowing through your pipelines?Next Step: Validate ⏩
Know how to validate data flow already? Next Step: Congrats! ⏩
Coming from AWS Install?
Next Step: Validate ⏩
Know how to validate data flow already? Next Step: Congrats! ⏩
Using Postman to send data to MDAI Cluster
Sending Telemetry via Postman
Visit our MDAI Postman github repo to learn how to configure Postman using helpful environment variables and our pre-defined postman collection for sending logs, metrics, and traces via HTTP requests.
Coming from Local Install?
⏪ Back to Verify Installation Want to validate telemetry data flowing through your pipelines?Next Step: Validate ⏩
Know how to validate data flow already? Next Step: Congrats! ⏩
Coming from AWS Install?
Next Step: Validate ⏩
Know how to validate data flow already? Next Step: Congrats! ⏩
Using a real agent/collector to send data to MDAI Cluster
Visit the OTel Collector Docs site to learn more about configuring your collector based on your specific data sources and destinations.
General setup and connectivity from collector to MDAI
- Determine which sources of data (collector/agent) you'd like to point at your MDAI Cluster instance.
- Use your CNAME (from your host provider) or DNS (from AWS LB) as mentioned in our Ingress documentation.
- Configure your agent/collector to point to the CNAME or DNS as mentioned in our Ingress documentation.
- SEE RESULTS! Verify data flow
Where can I find my ingress endpoints?
Finding and setting HTTP_HOST and GRPC_HOST
Not sure where to get the variables for GRPC_HOST and HTTP_HOST?
- I need my Cloud env. variables Get them now!
- I need my Local env. variables Get them now!
Cloud
GRPC_HOST & GRPC PORT
You can find your GRPC_HOST value by running:
kubectl get ingress -n default
Your output should look something like this...
For gateway_ingress, note the HOSTS value. This will be used for your host
Your port will always be :443, as this is the secure listener for your gRPC endpoint.
You can also make note of the mdai-console-ingress, ADDRESS value to validate requests sent from postman later.
Note: Your ingress endpoint for gRPC connections will be in the following format...
${host}:${port}
HTTP_HOST & HTTP_PORT
You can find your http ingress endpoint value by running:
kubectl get svc gateway-collector -n default
Your output should look something like this...
For the gateway_collector service, note the EXTERNAL-IP value. This will be used for your host
Your port will always be :4318, as this is the secure listener for your http endpoint.
Note: Your ingress endpoint for http connections will be in the following format...
https://${host}:${port}
Examples coming soon
While we know these docs will help guide you to the right configuration, we understand you might need further help. We're actively working on examples connecting commonly used collectors/agents to an MDAI Cluster.
If you have special requests for how-to-guides..
- Email us at support@mydecisive.ai
- File an issue under the MDAI InkOps Project
⏪ Back to Intro: Generate and Receive Telemetry Next Step: TelemetryGen ⏩
Advanced Configurations
We have a few advanced configuration options that you can apply to your Cluster.
AutoScaling
Local only
AWS
Modules
Other
Coming soon...
AutoScaling
OpenTelemetry Collector
We have built an HPA config for one of our cluster's core components, the OTel collector app (lib/mdai-operator.yaml) with the following settings:
# 2 replicas recommnded
replicas: 2
# mandatory only when  autoscaler is enabled
# otherwise optional. can be used to limit resources consumtion
resources:
  limits:
    cpu: 500m
    memory: 500Mi
  requests:
    cpu: 250m
    memory: 250Mi
Benchmarking - Plans for the future!
We are working hard to understand and create multiple configurations that are resource and cost-effective under predictable and variable workload demands.
We will soon publish a report of the current constraints we are using for testing the above configuration, as well as others.
Other Cluster Components
📺 Coming soon! Stay tuned! 📺
We will shortly begin work on optimizing HPA (or any other scaling method) for both the following components pending community feedback
- MDAI Console
- Datalyzer module
Have some recommendations for where we should spend our energy?
Are you experiencing any pain using the MDAI Cluster? Do you have specific configurations or workload demands you'd like us to help test?
- Email us at support@mydecisive.ai
- File an issue under the MDAI InkOps Project
⏪ Back to: Installation Next up: MDAI Console Usage ⏭️
Node AutoScaling
Karpenter NodePool Settings
The following configuration is used for Karpenter to properly autoscale the EC2 Nodes that your Cluster runs on.
apiVersion: karpenter.sh/v1beta1
kind: NodePool
metadata:
  name: default
spec:
  template:
    spec:
      requirements:
        - key: kubernetes.io/arch
          operator: In
          values: ["amd64"]
        - key: kubernetes.io/os
          operator: In
          values: ["linux"]
        - key: karpenter.sh/capacity-type
          operator: In
          values: ["on-demand"]
        - key: karpenter.k8s.aws/instance-category
          operator: In
          values: ["t"]
        - key: karpenter.k8s.aws/instance-family
          operator: In
          values: ["t2"]
        - key: node.kubernetes.io/instance-type
          operator: In
          values: ["t2.micro"]
      nodeClassRef:
        apiVersion: karpenter.k8s.aws/v1beta1
        kind: EC2NodeClass
        name: default
  limits:
    cpu: 1000
  disruption:
    consolidationPolicy: WhenUnderutilized
    expireAfter: 720h # 30 * 24h = 720h
Benchmarking - Plans for the future!
We are working hard to understand and create multiple configurations that are resource and cost-effective under predictable and variable workload demands.
We will soon publish a report of the current constraints we are using for testing the above configuration, as well as others.
Have some recommendations for where we should spend our energy?
Are you experiencing any pain using the MDAI Cluster? Do you have specific configurations or workload demands you'd like us to help test?
- Email us at support@mydecisive.ai
- File an issue under the MDAI InkOps Project
⏪ Back to: Installation Next up: MDAI Console Usage ⏭️
Managing Ingress for the MDAI Cluster's OTel Collector
DNS
To expose the MDAI Cluster's OpenTelemetry Collector to the public, we've simplified the provisioning of two types of Load Balancers.
- AWS Application Load Balancer
mdai-grpc-endpoint - AWS Network Load Balancer
mdai-non-grpc-endpoint
These Load Balancers receive gRPC and non-gRPC (HTTP, TCP, UDP) data respectively.
The Load Balancers can be referred to by their DNS names, which are assigned by AWS. 
For secure connectivity, it’s highly recommended - and for TLS (SSL) endpoints, required - that you create CNAME DNS records in your domain, pointing to the Load Balancer DNS names generated by AWS.
gRPC
In order to provide routing for multiple gRPC receivers of the same type, each receiver should have its own hostname in your public domain. Additional configuration steps are required to provide a mapping between the receiver name and its proposed hostname. A single gRPC Load Balancer will be able to manage ingest from multiple gRPC sources. The current version of the MDAI Cluster only provisions a single gRPC Load Balancer by default.
Example
LB DNS name:
mdai-grpc-endpoint.us-east-1.elb.amazonaws.com
OTel Collector Configuration Excerpt: ( This example has 2 gRPC receivers. )
service:
  pipelines:
    traces:
      receivers: [jaeger, otlp]
      processors: [memory_limiter, batch]
      exporters: [debug]
Required CNAME records in domain your-domain.io:
| CNAME | AWS DNS NAME | Access URL |
| ----------- | --------------- |------------ |
| jaeger.grpc.endpoint | mdai-grpc-endpoint.us-east-1.elb.amazonaws.com | jaeger.grpc.endpoint.your-domain.io |
| otlp.grpc.endpoint | mdai-grpc-endpoint.us-east-1.elb.amazonaws.com | otlp.grpc.endpoint.your-domain.io |
Manual updates for OpenTelemetry Collector configuration
You would then need to update your OTel configuration to reflect these changes before the MDAI Cluster can receive telemetry via the Access URL.
Navigate to your values/params-values-otel.yaml file:
collectorEndpoints:
  otlp: otlp.grpc.endpoint.collector.your-domain.io
  jaeger: jaeger.grpc.endpoint.collector.your-domain.io
non-gRPC
Example
LB DNS name
mdai-non-grpc-endpoint.us-east-1.elb.amazonaws.com
Required CNAME records in domain your-domain.io:
| CNAME | AWS DNS NAME | Access URL |
|---|---|---|
endpoint | mdai-non-grpc-endpoint.us-east-1.elb.amazonaws.com | endpoint.your-domain.io |
TLS (SSL)
TLS (SSL) Certificates should be generated and issued for all chosen host names.
Steps for Issuing or Importing a Certificate
- Choose to Import or Issue a Certificate
- Once you have access to your certificate in AWS ACM, it will be accessible via Amazon Resource Name (ARN). These ARNs need to be provided as a configuration parameter during the configuration phase, so make note of these ARNs.

gRPC
-
TLS (SSL) is MANDATORY for the gRPC endpoint.
-
From the example above, the gRPC host names that would need certificates are:
jaeger.grpc.endpoint.your-domain.iootlp.grpc.endpoint.your-domain.io
-
After identifying the certificate ARN, you are required to update the
values/params-values-otel.yamlfile:
spec:
  ingress:
    annotations:
      alb.ingress.kubernetes.io/certificate-arn: arn:aws:acm:us-east-1:1234567890:certificate/th15-15-@n-@ut0g3n3r@ted-numb3r
non-gRPC
-
SSL is not mandatory, but is highly recommend for non-gRPC ingress.
-
From the example above, the gRPC host name that would need a certificate is:
endpoint.your-domain.io
-
After identifying the certificate ARN, you are required to update the
values/params-values-otel.yamlfile:
metadata:
  name: test-collector
  namespace: default
  annotations:
    service.beta.kubernetes.io/aws-load-balancer-ssl-cert: arn:aws:acm:us-east-1:1234567890:certificate/th15-15-@n-@ut0g3n3r@ted-numb3r
Console
DNS
To expose your MDAI Console UI to the public Internet, an AWS Application Load Balancer mdai-console will be provisioned.
This Load balancer can be referred to by its DNS name, which is provided by AWS. For secure connectivity, it’s highly recommended - and for TLS (SSL) endpoints, required - that you create CNAME DNS records for your domain that point to the Load Balancer DNS names generated by AWS.
Example
LB DNS name: mdai-console-12345678910.us-east-1.elb.amazonaws.com
Required CNAME records in domain your-domain.io:
| CNAME | AWS DNS NAME | Access URL |
| ----------- | --------------- |------------ |
| mdai-console | mdai-console-12345678910.us-east-1.elb.amazonaws.com | mdai-console.your-domain.io |
TLS (SSL)
TLS (SSL) can be enabled for the MDAI Console UI endpoint. In order to do that, a TLS (SSL) certificate should be issued for the chosen hostname (i.e. mydecisive.domain.dom from the example above), imported into the AWS ACM, and accessed via Amazon Resource Name (ARN).
This ARN needs to be provided as a configuration parameter during the configuration phase in the file: values/aws.env
Example:
MDAI_UI_ACM_ARN=arn:aws:acm:us-east-1:12345678900:certificate/eaa7da72-1c8d-4277-8131-ab9dfdc35f37
Back to Deploy Your MDAI Cluster
Next Step: Verify Your Installation >>
Datalyzer Module
Primary objective
Track and analyze the total and actual OpenTelemetry Protocol (OTLP) bytes transferred by each source (service/resource) through a collector.
How it works
We built in a special OTLP Service that we export data to that allows us to understand the sender (by service.name) of a pLog, pMetric, and/or pTrace records, as well as measuring the payload size for each record that flow through your pipelines.
This helps us answer your questions:
- Who's sending the most data in and out of my cluster
- How much are they sending in and planning to send out of my cluster?
See it in action
- Visit the Analysis tab in your console.
- Send some payloads (real or fake).
- See the sender and size of message in and out of your cluster!
- Save money, eat cake instead! 🍰
Usage Guide
Using the MDAI Console
OTel Management
Use Cases
Telemetry Muting
The MyDecisive MDAI Cluster Console
Introduction
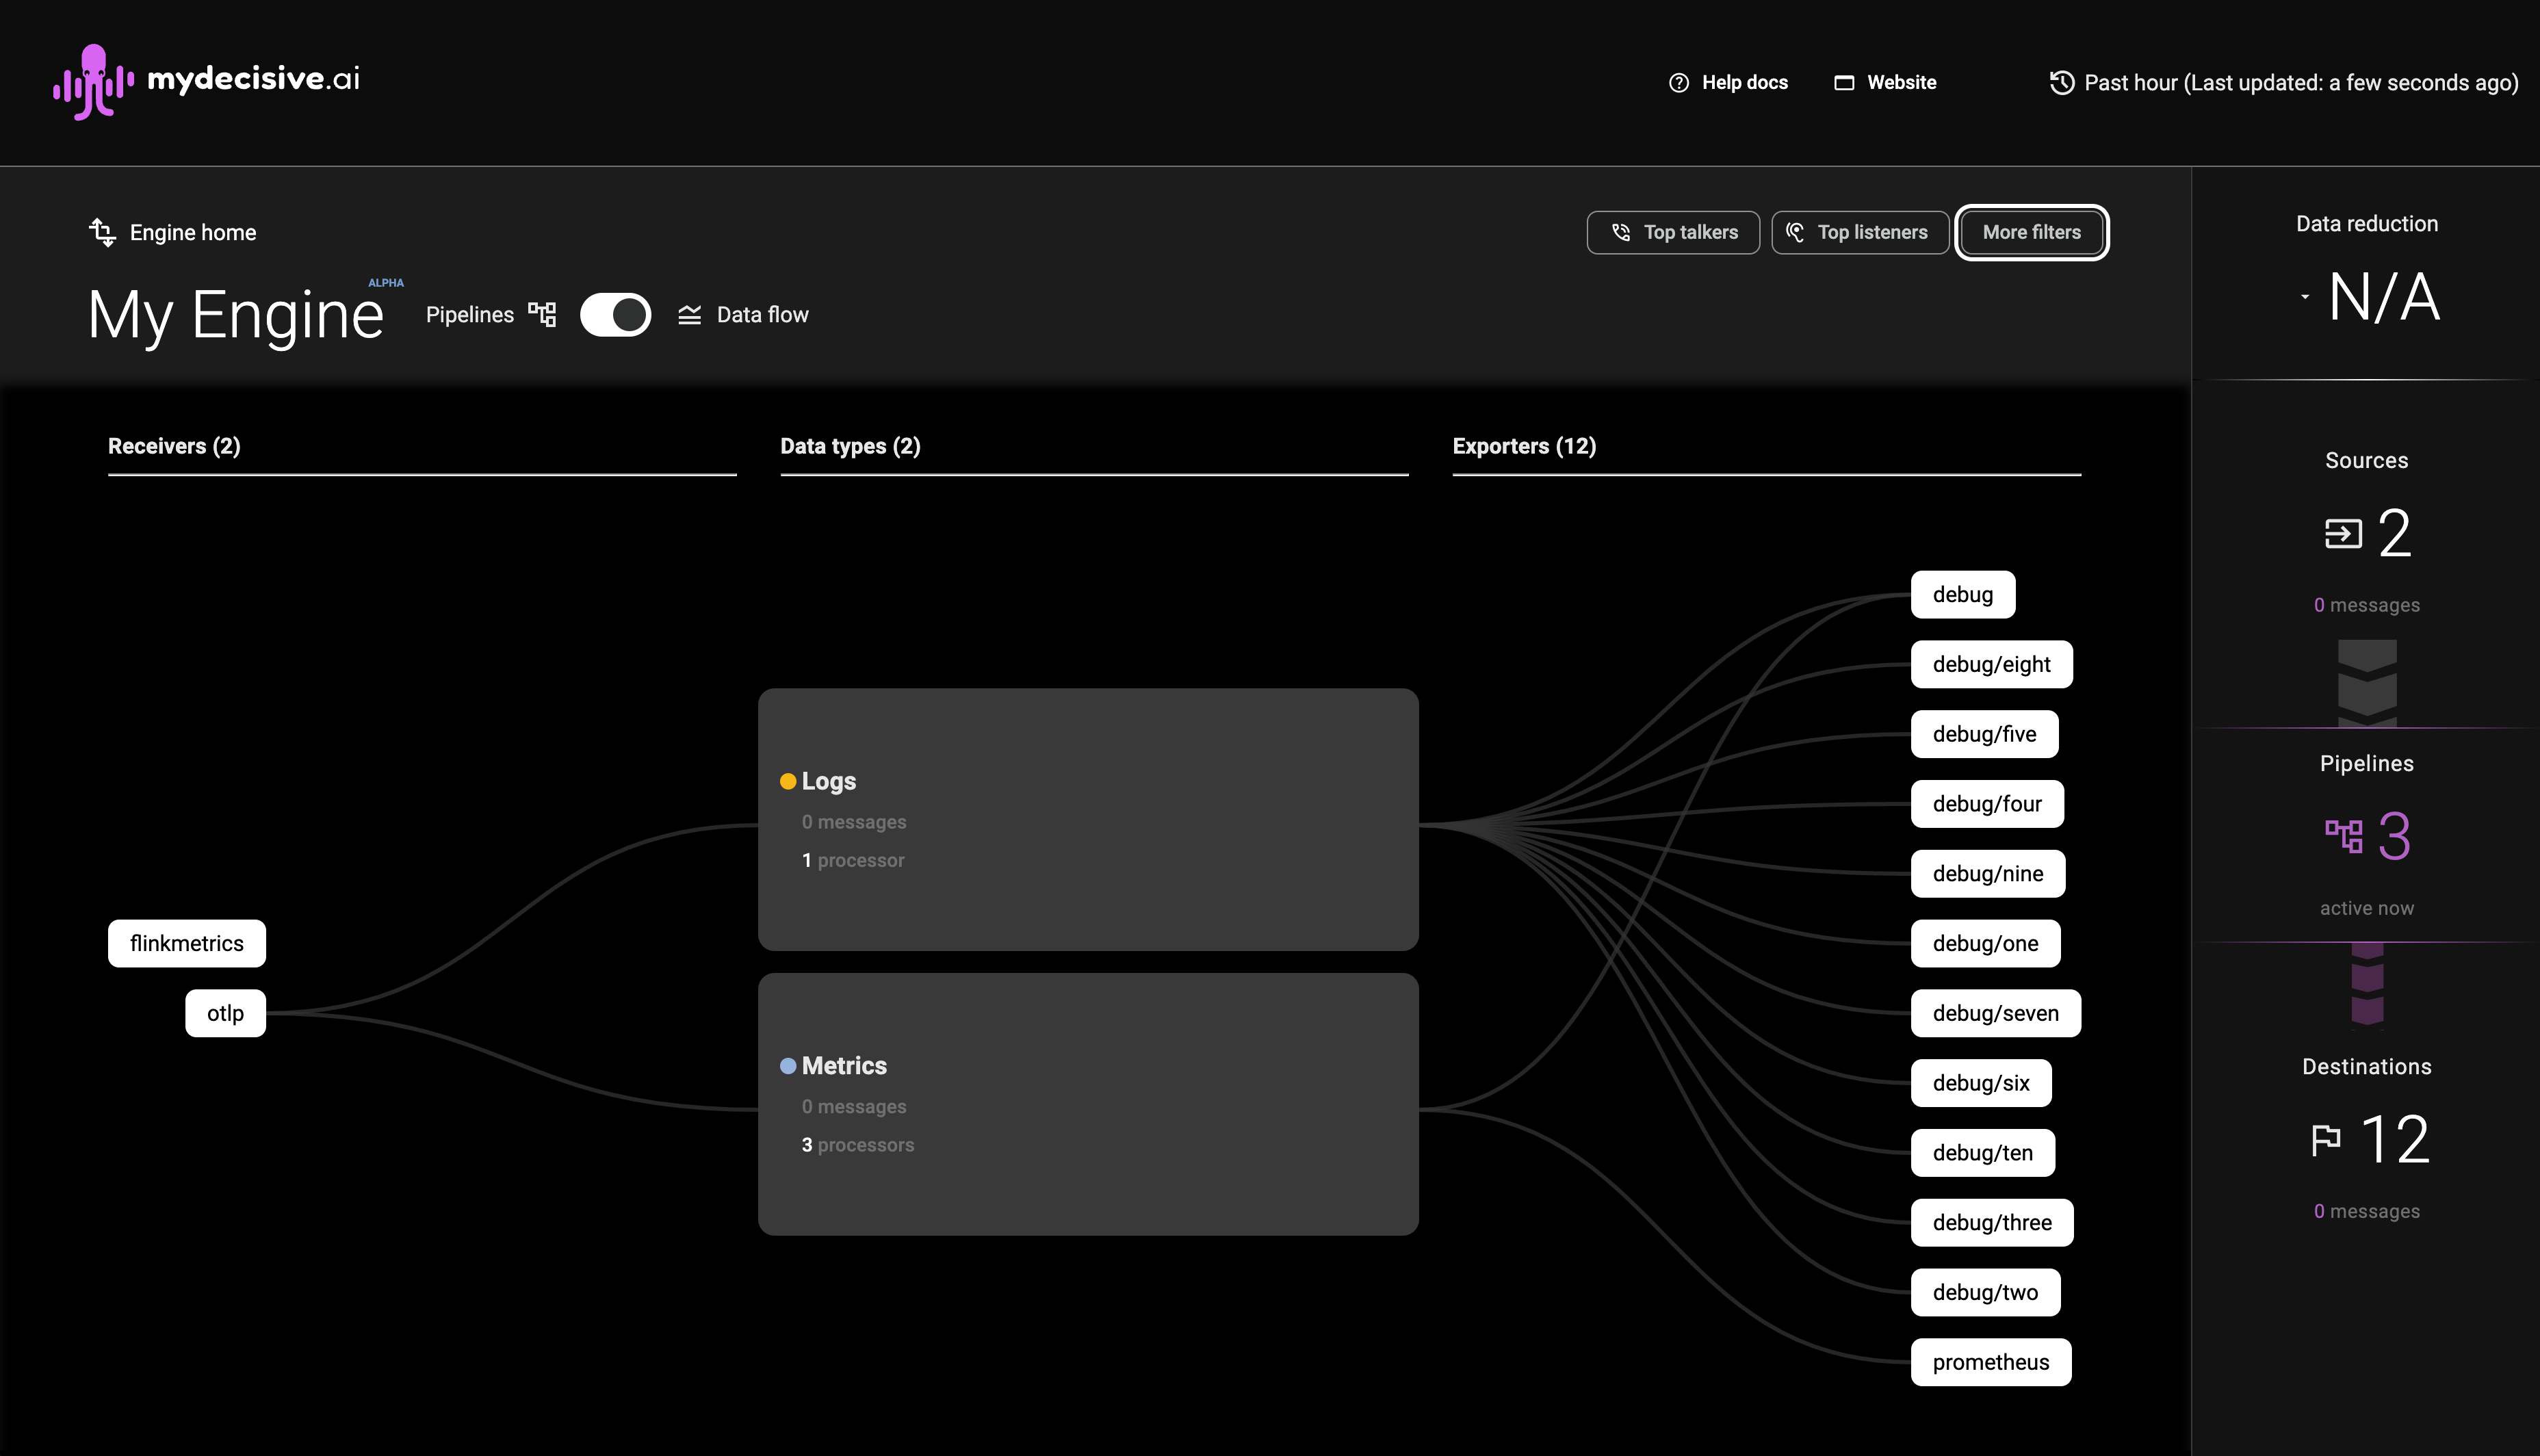
The MyDecisive MDAI Cluster console provides an at-a-glance display of all the telemetry data that has flowed through your MDAI Cluster in the last hour. It is a web application accessible via HTTPS within the MDAI Cluster.
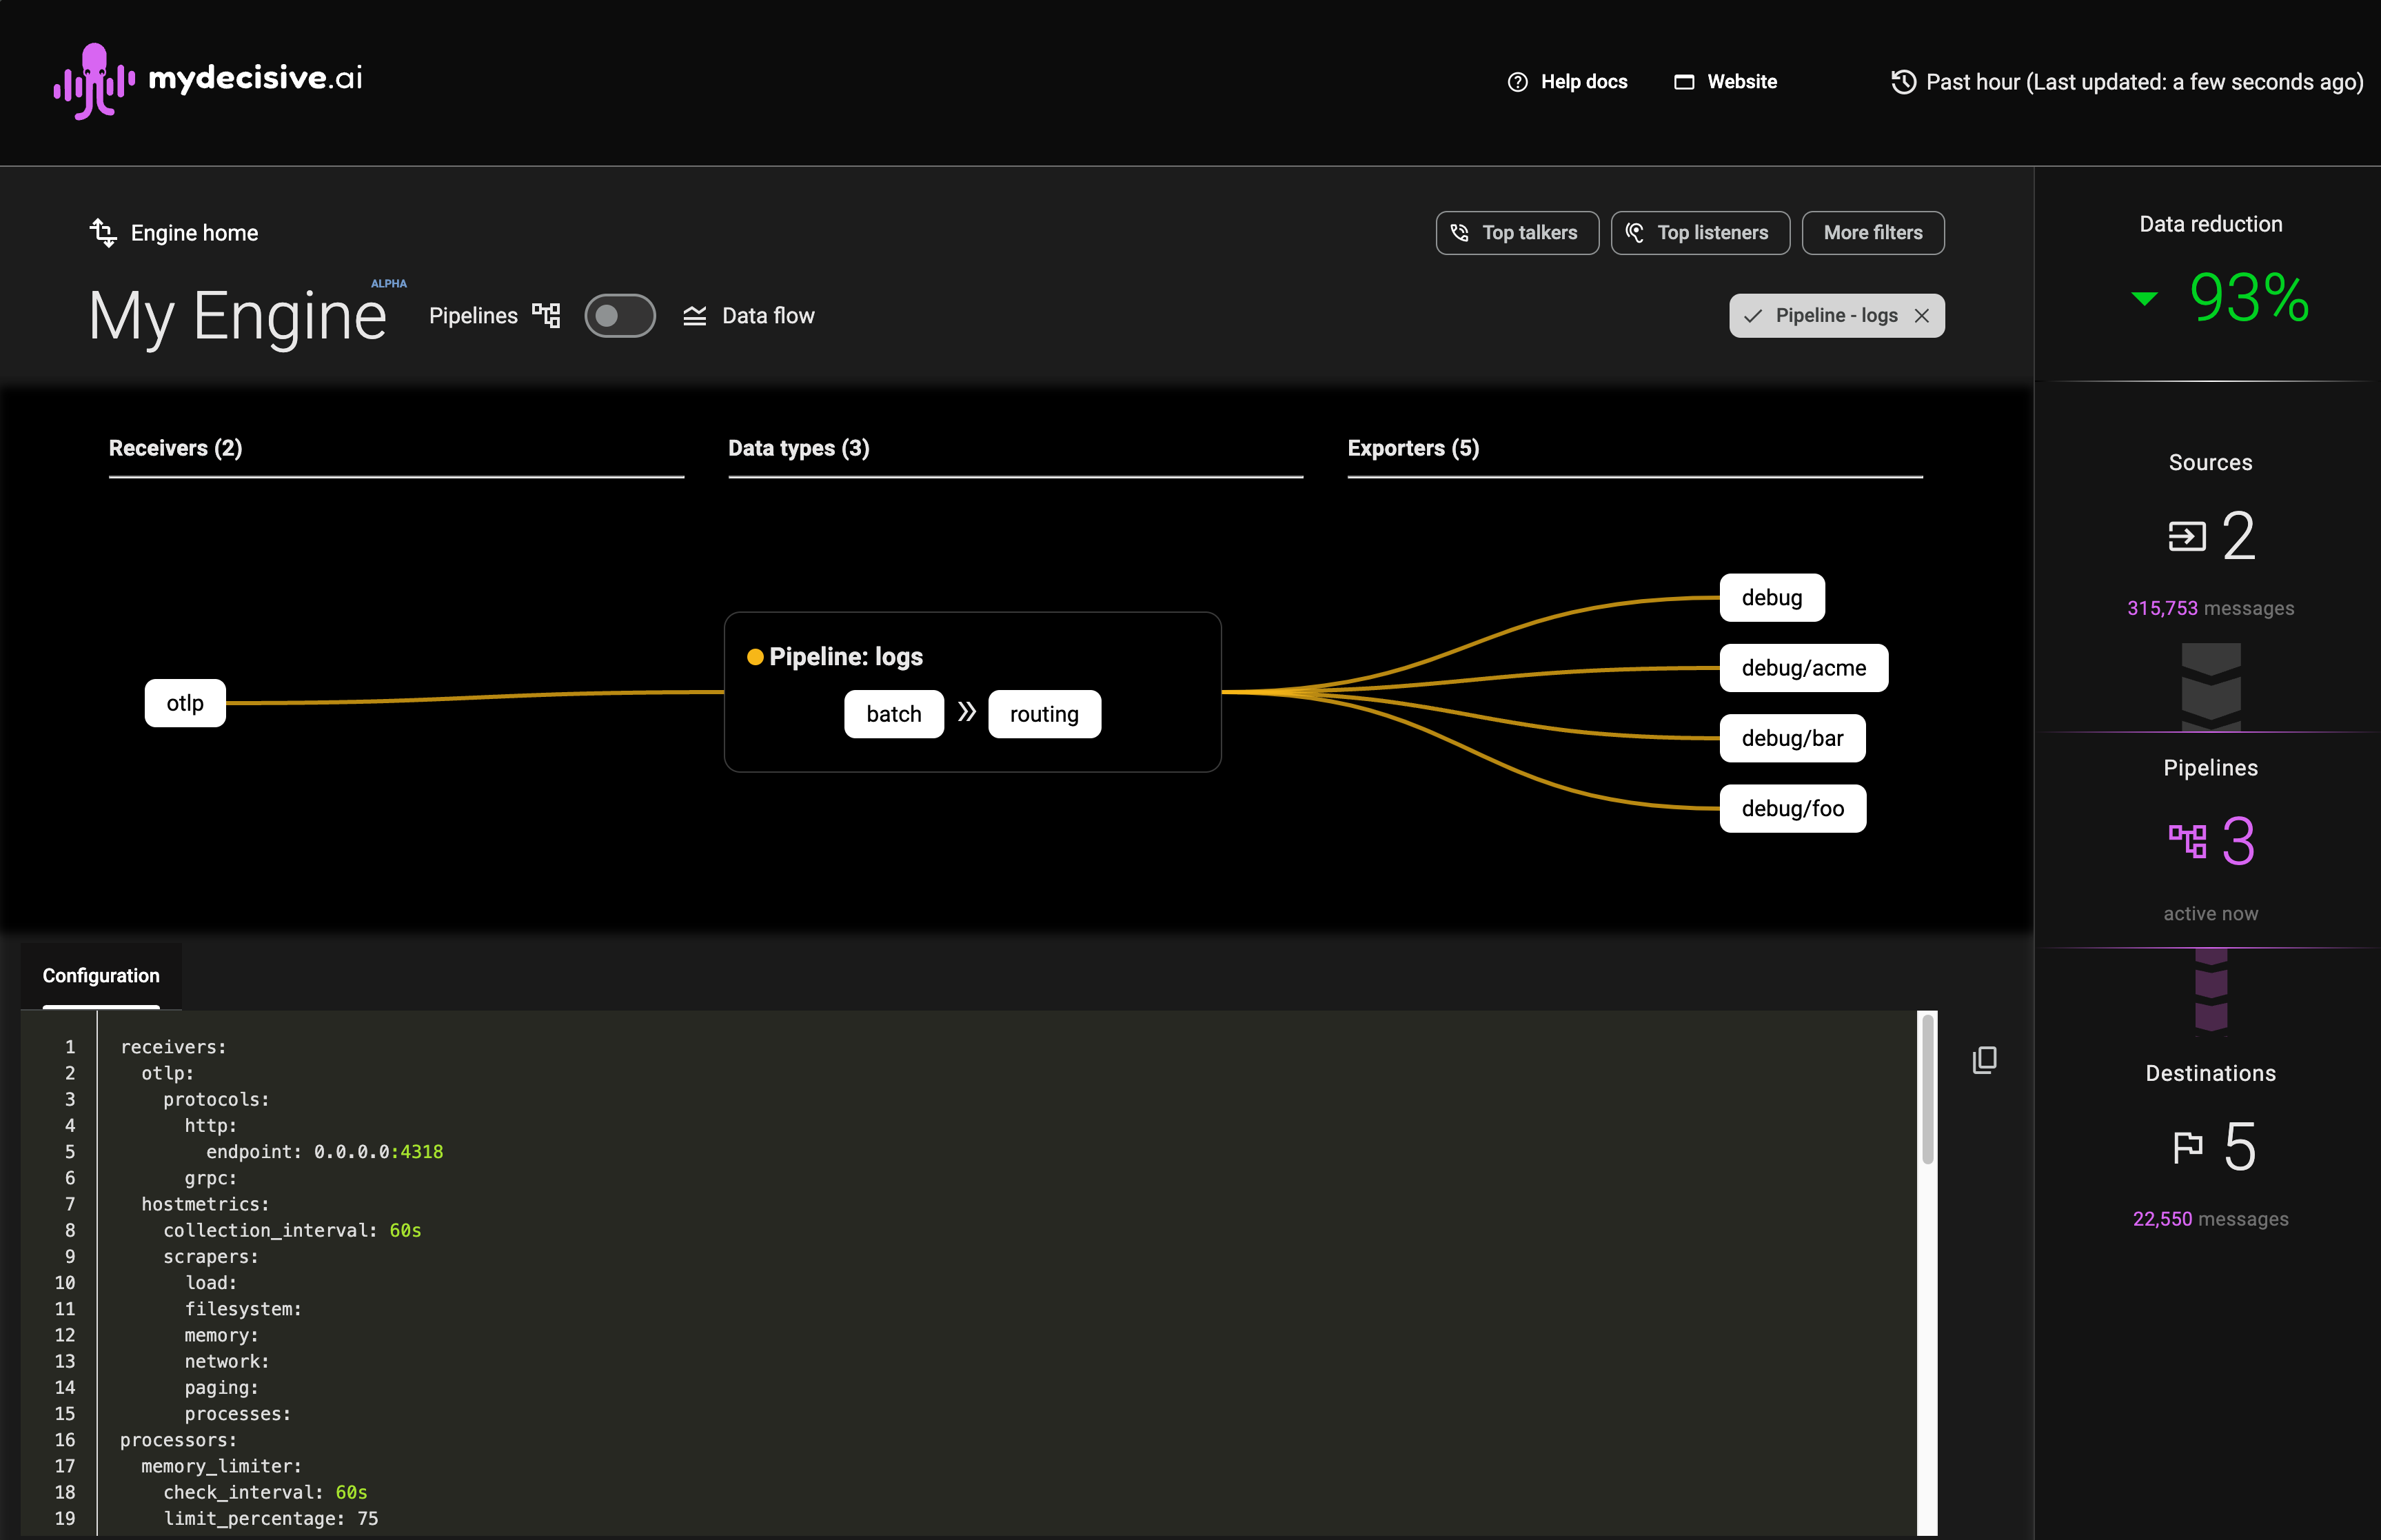
Data Flow Overview
The console offers three primary areas to help you understand how your data flows: Sankey Diagram: A. The main section displays a Sankey diagram showing the data flow. B. Filters: Filters at the top allow you to customize what you see. C.Sidebar: On the right, a sidebar summarizes your data totals and data reduction.
Sankey Diagram

The initial view (A) of the diagram shows how your different data types (Metrics, Logs, and Traces) flow from receivers to exporters, allowing you to see the overall data volumes flowing through the system.
Hovering over any component highlights the specific data path(s), helping you zero in on a specific issue.
Pipeline View
Clicking on any component in the Sankey diagram will filter and switch the view to a pipeline view. This shows all data types interacting with that component and highlights its configuration in the textual configuration view, allowing you to see the composition of your pipeline.
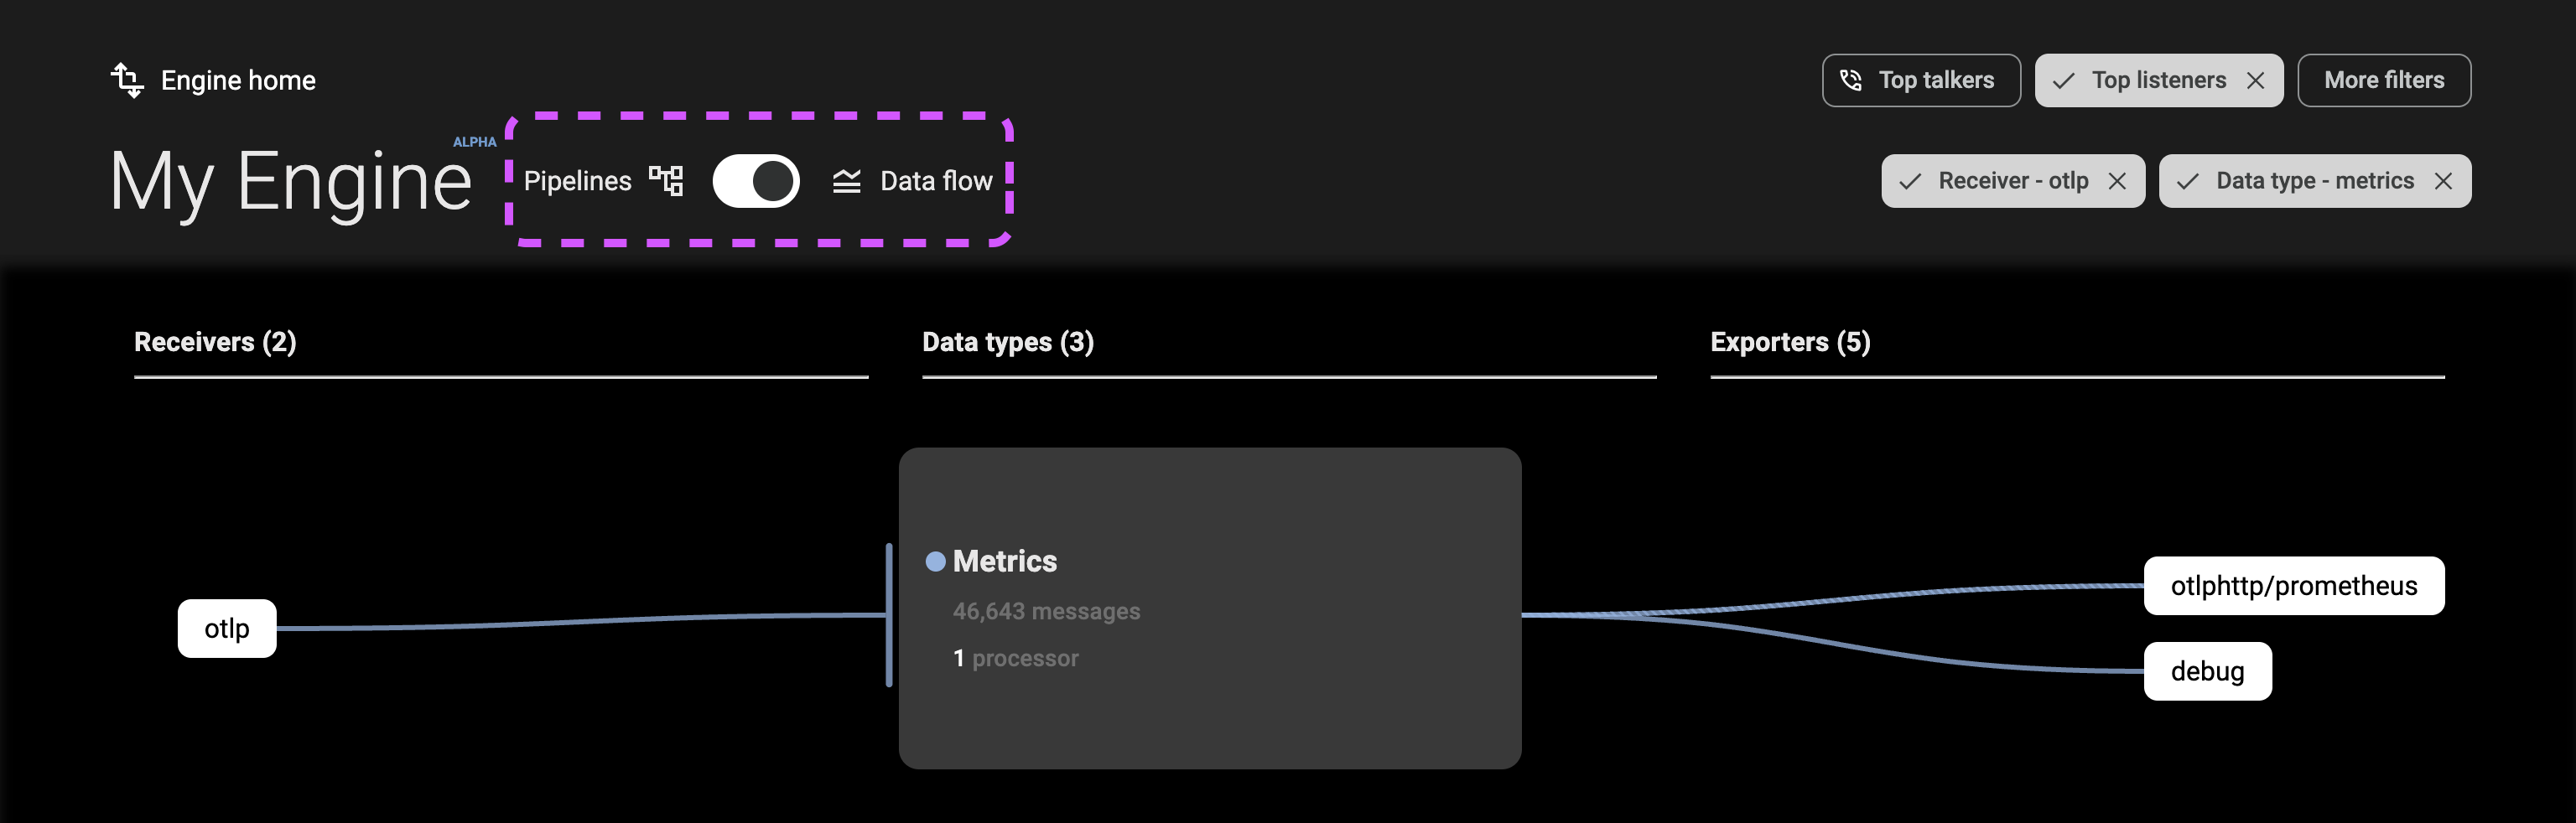
As you view the console to understand your data flows, you can switch between Pipeline and Data flow view at any time to see the appropriate elevation.
Filters
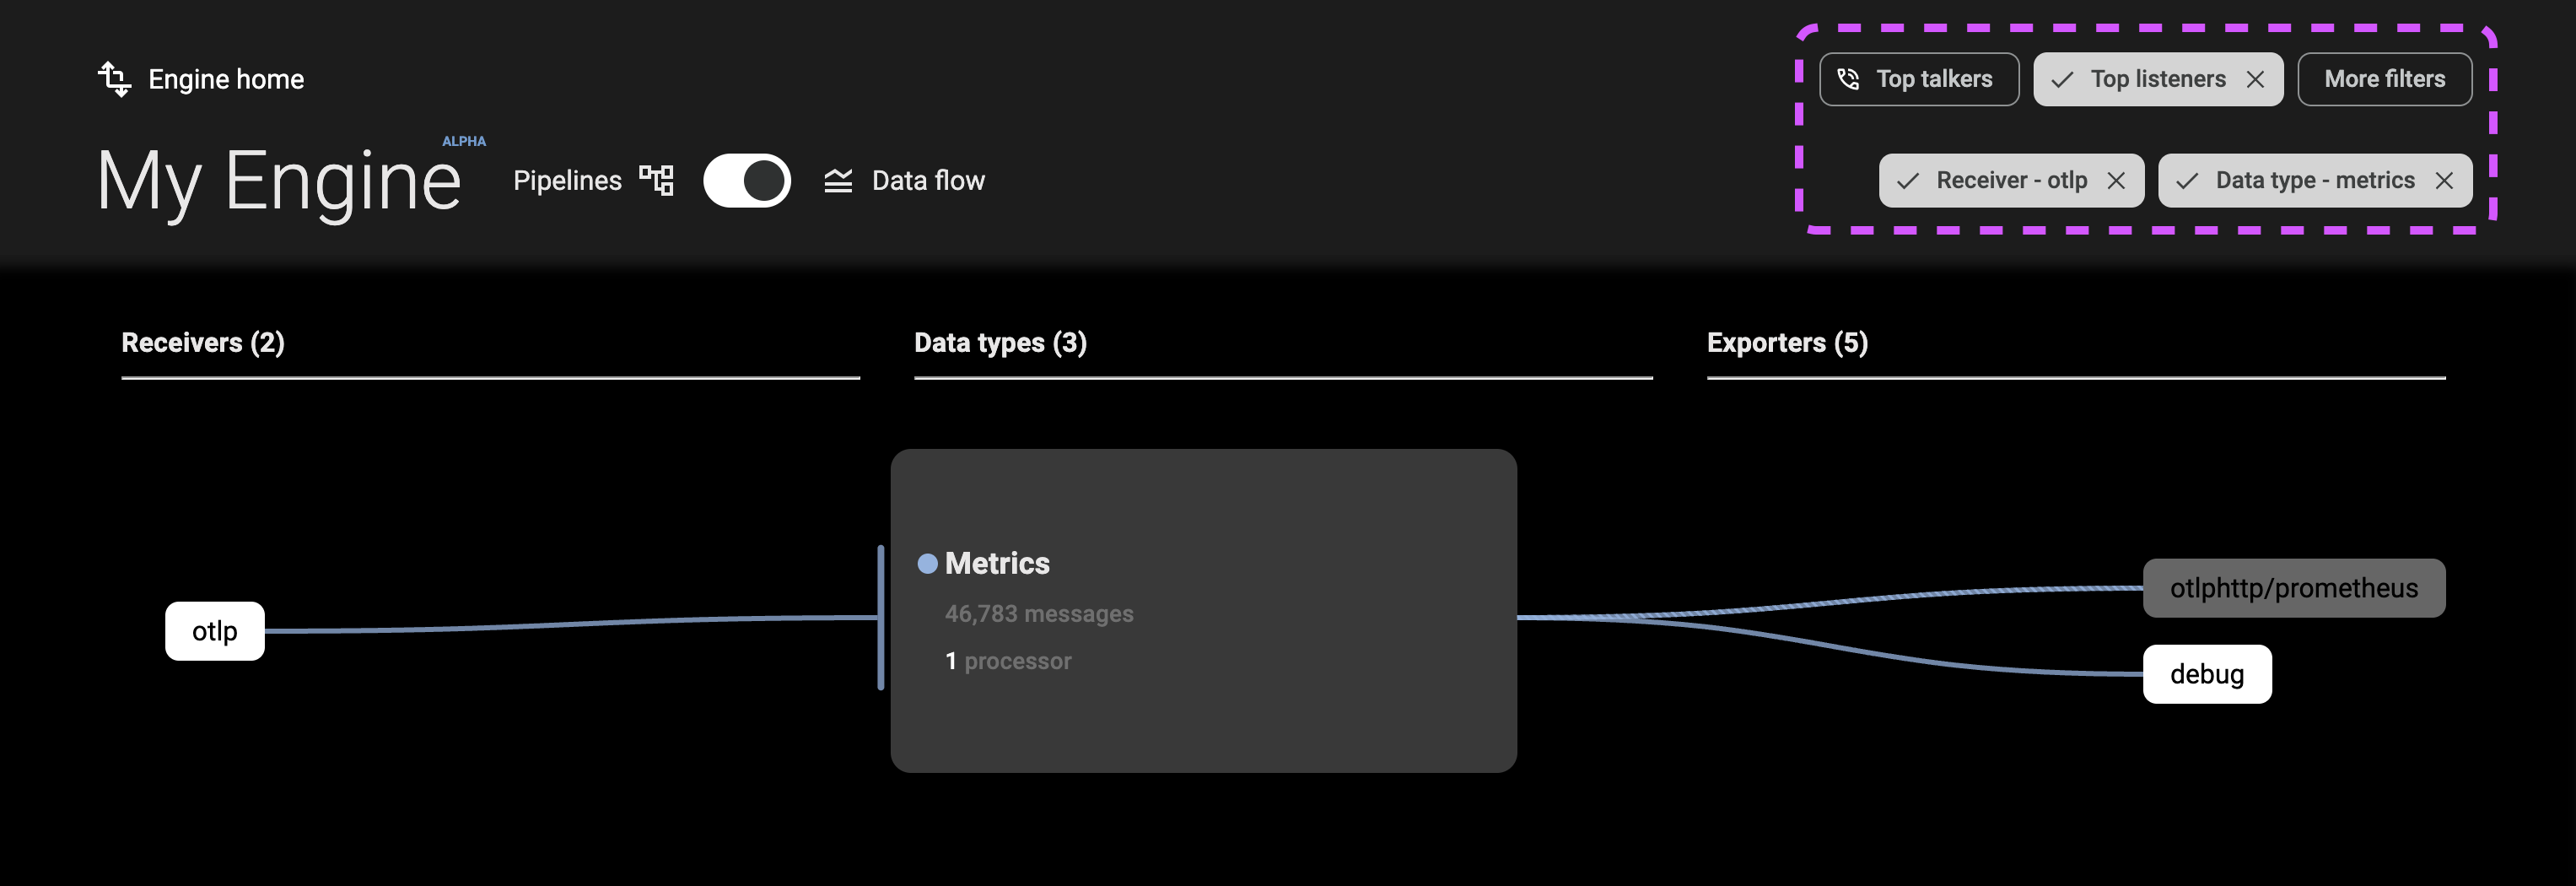
The filters (B) at the top-right of the console allow you to constrain the data flow and pipeline views to specific components or data types. These filters can be combined, and options are automatically refined based on your selections.
Top Talkers and Top Listeners
The Top Talkers filter shows the top three receivers by data volume, and the Top Listeners filter shows the top three exporters by data volume.
More Filters
The More Filters menu allows you to filter your view by receiver, processor, data type, or exporter.
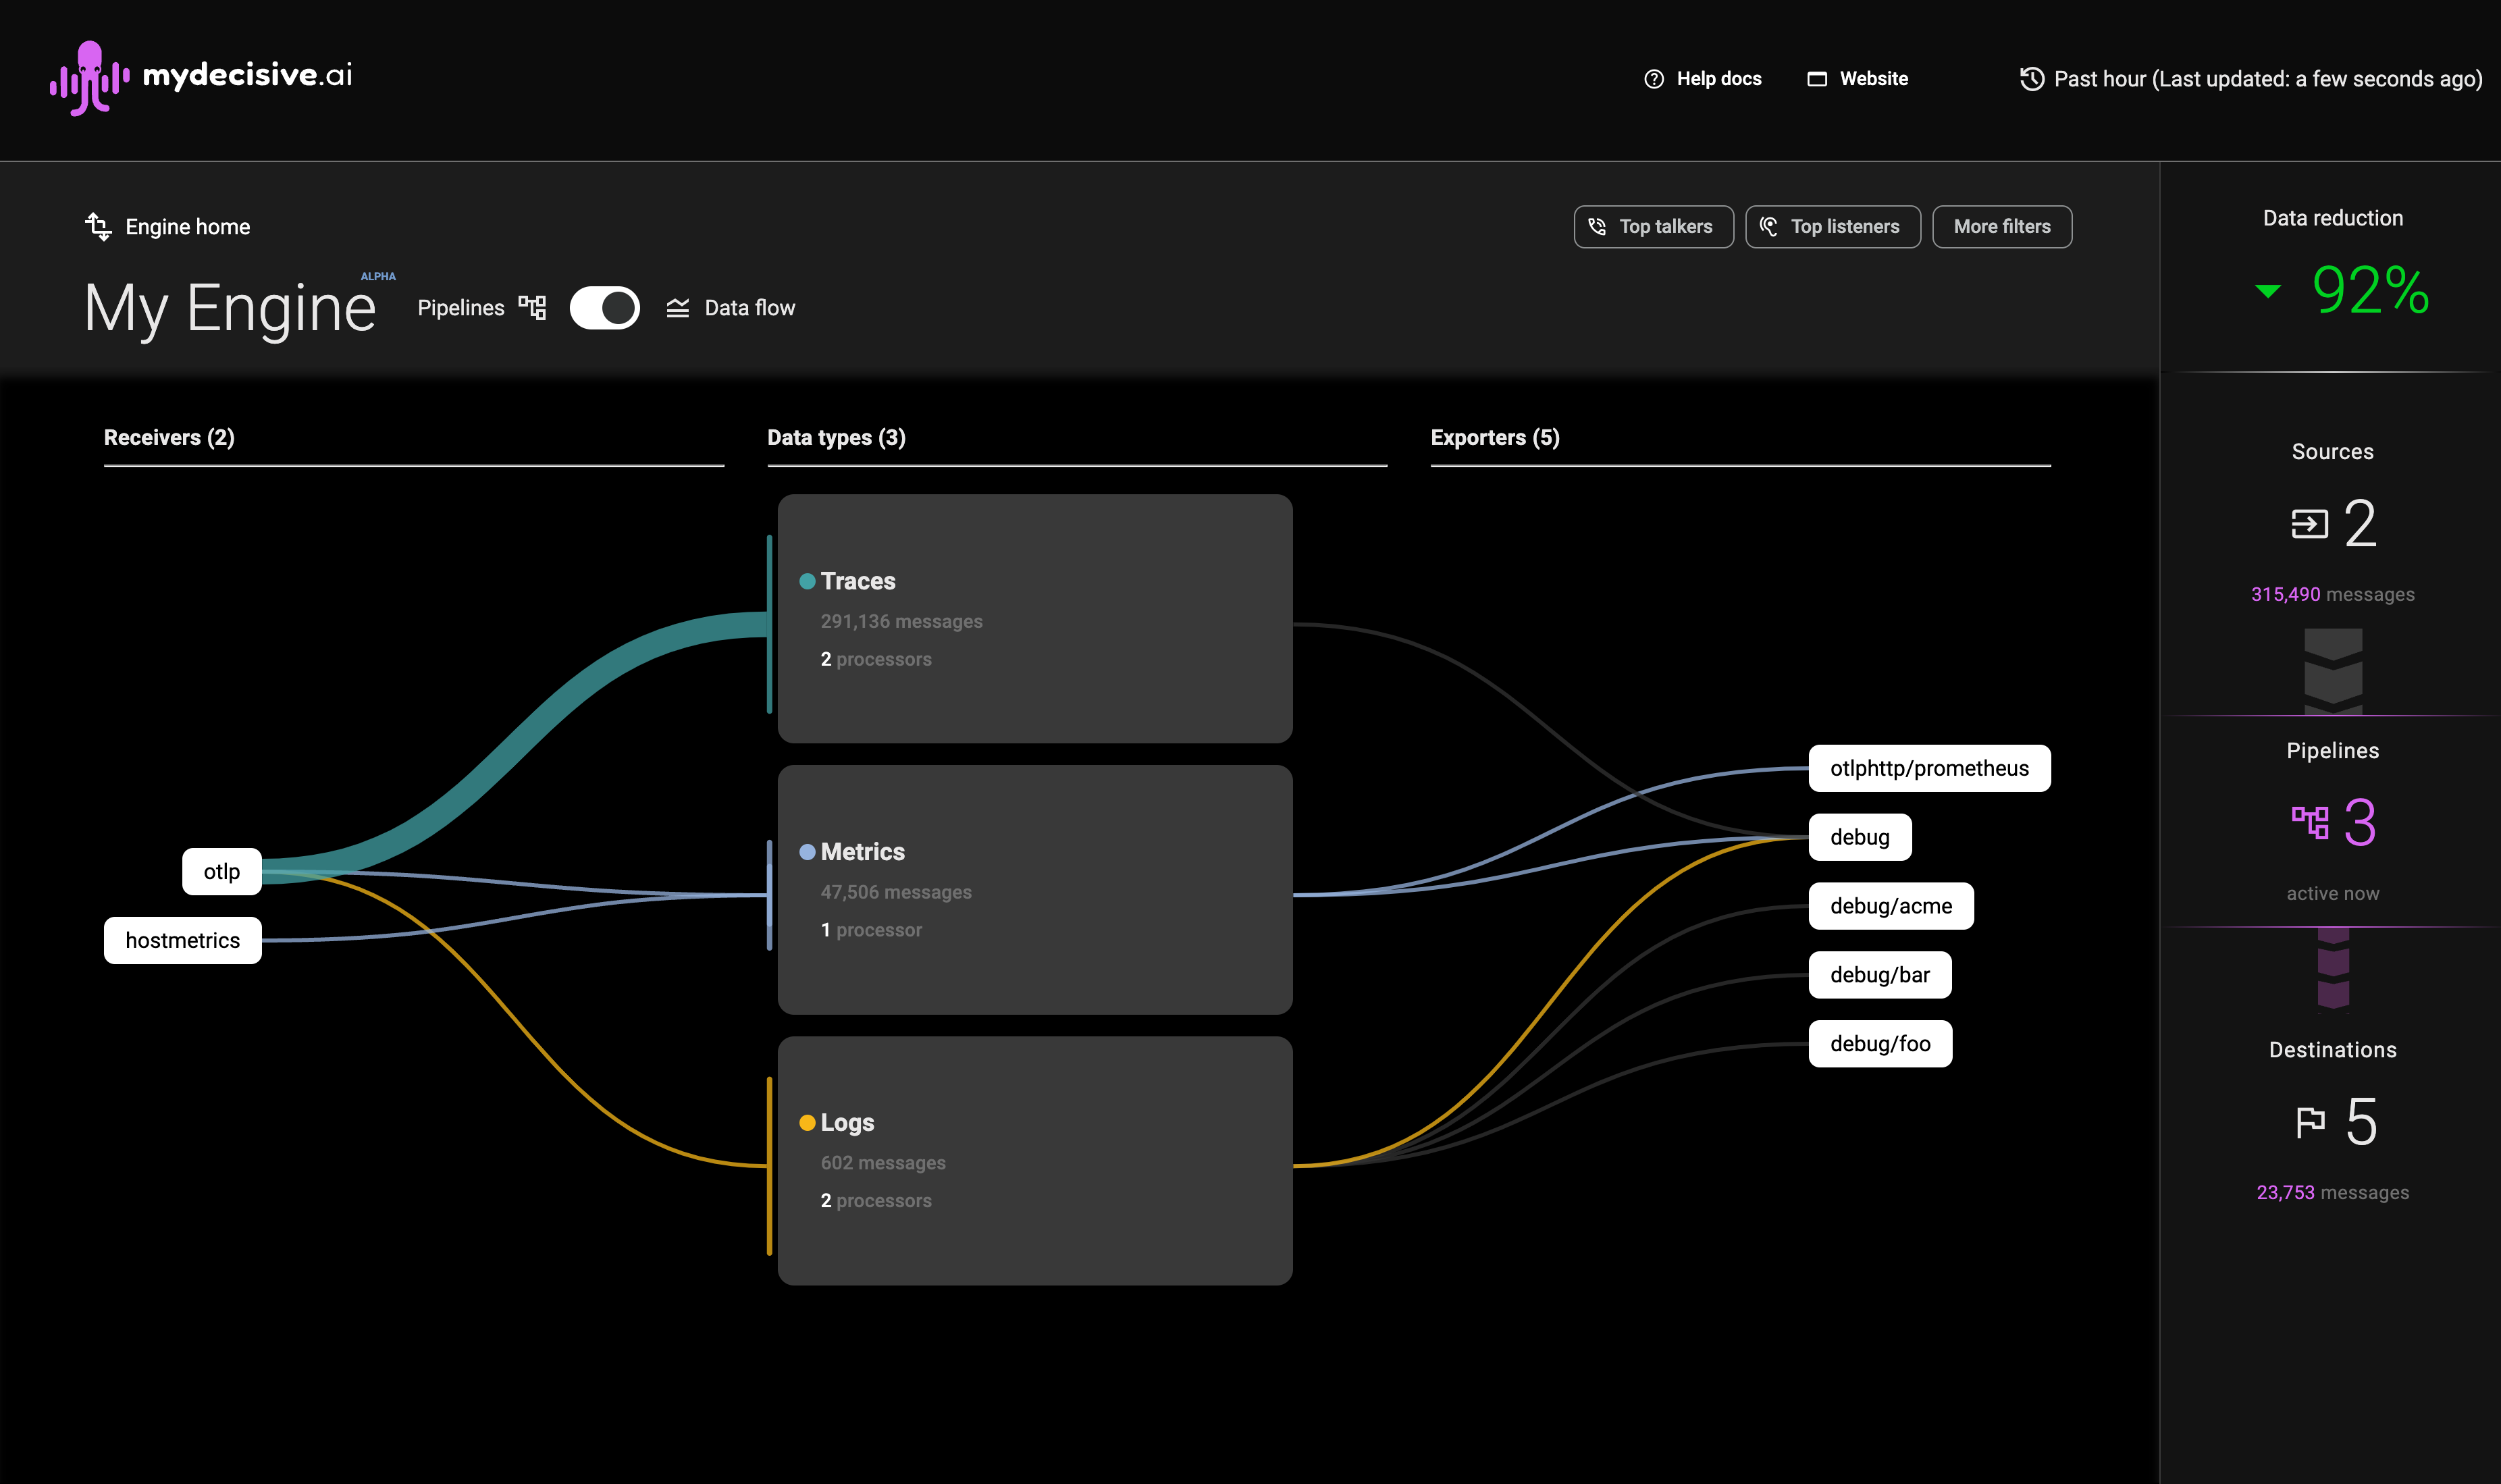
Summary of Data Totals and Data Reduction
The console sidebar (C) displays:
- A count of receivers, pipelines, and exporters running on your collectors
- The total volume of data flowing through them in the last hour
The sidebar updates with other changes on the page, allowing you to optimize your pipelines for maximum cost efficiency.
Note: Traffic flowing to debug exporters is not counted in data flow totals.
Telemetry Pipeline Manual Muting
⚠️ This page assumes that you've already done the installation process either locally or cloud-based. ⚠️
TL;DR
Tell me what I'm getting with Manual Mute
An MDAI Cluster provides the ability to mute by Metrics, Logs, and/or Trace data within OpenTelemetry telemetry pipelines. You can do this with our CLI, or from your MDAI Cluster's Console.
Telemetry Muting
One of our primary goals is to give back full-control of telemetry pipelines. Moving and storing data is expensive.. it doesn't have to be. Imagine a world where you only send data to observability vendors when you need to, i.e., coming up on an event (incident, spike in activity, etc).
📣 Introducing Manual Muting! 📣
What is Telemetry Muting?
Simple! Telemetry muting is the act of stopping data flow through a telemetry pipeline, period.
Through our muting capability, you can create rules in your data pipelines that will help you stop/start data flow. These rules can be enabled or disabled on-demand, however, manually. We plan to continue building out this capability, so stay tuned for more updates.
Why use Telemetry Muting?
Cost Savings & Telemetry Control
As we mentioned, it's very expensive to send data into and out of your technology envelope. Not only is it expensive, but not all data is high-priority data.
Manual muting affords you the ability to start and stop data flow and saving money by only sending the highest priority data per your definition. This can be achieved by:
- A CLI command to apply mute rules to your OTel pipelines
- Using the MDAI Console's streamlined rule builder wizard to apply mute rules to your OTel pipelines
Note: Both of these options will work together, so you can choose what works best for you after experimenting.
❗️Limited support❗️
Our first iteration of muting only allows you to mute by one or all of Metrics, Logs, and Trace based pipeline definitions. Don't worry, we're hard at work to expand the Telemetry Muting capability.
Future Enhancements
Based on usage and adoption of this feature, we plan to expand the ability to have telemetry and cost controls.
If you have feedback or suggestions about the future of automute.
- Email us at support@mydecisive.ai
- File an issue under the MDAI InkOps Project
Mute Rules
What are mute rules?
Mute rules are contextual configurations (instructions) that allow the ability to control data flow through defined OTel Pipeline configuration for a given cluster
Available Rules
-
Add a rule - Allows a user to apply muting instructions to a given pipeline.
-
Toggle a mute rule - Allows a user to apply muting instructions to a given pipeline.
-
Edit a mute rule - Allows a user to modify muting instructions to a given pipeline.
-
Delete a mute rule - Allows a user to delete a muting instruction.
Start muting with the CLI now! ⏭️
Start muting with the Console now! ⏭️
Manual Muting via the MDAI CLI
Let's see muting in action with the MDAI CLI!
Note: You can find more helpful information for CLI usage in our CLI repo.
Add a mute rule
Toggle a mute rule
Unmute and remove rule
Manual Muting via the MDAI Console UI
Let's see muting in action within the Console!
Add a mute rule
Toggle a mute rule
Edit a mute rule
Delete a mute rule
Updating OpenTelemetry Configurations
If you find you'd like to modify your OpenTelemetry collector configuration, you have the option to change it.
Modify your OTel Config
Navigate to the lib/mdai-operator.yaml file and modify it to fit your needs.
Apply changes to your collector
You can now apply them to the cluster using the following command.
kubectl apply -f lib/mdai-operator.yaml
You should start seeing changes reflected immediately in the Console UI.
Contributing guide
Coming soon! Check back shortly.
Don't want to wait? Email us at support@mydecisive.ai
Troubleshooting
- 🐞 Known issues
- 🔎 Report a new issue!
🐞 Known issues
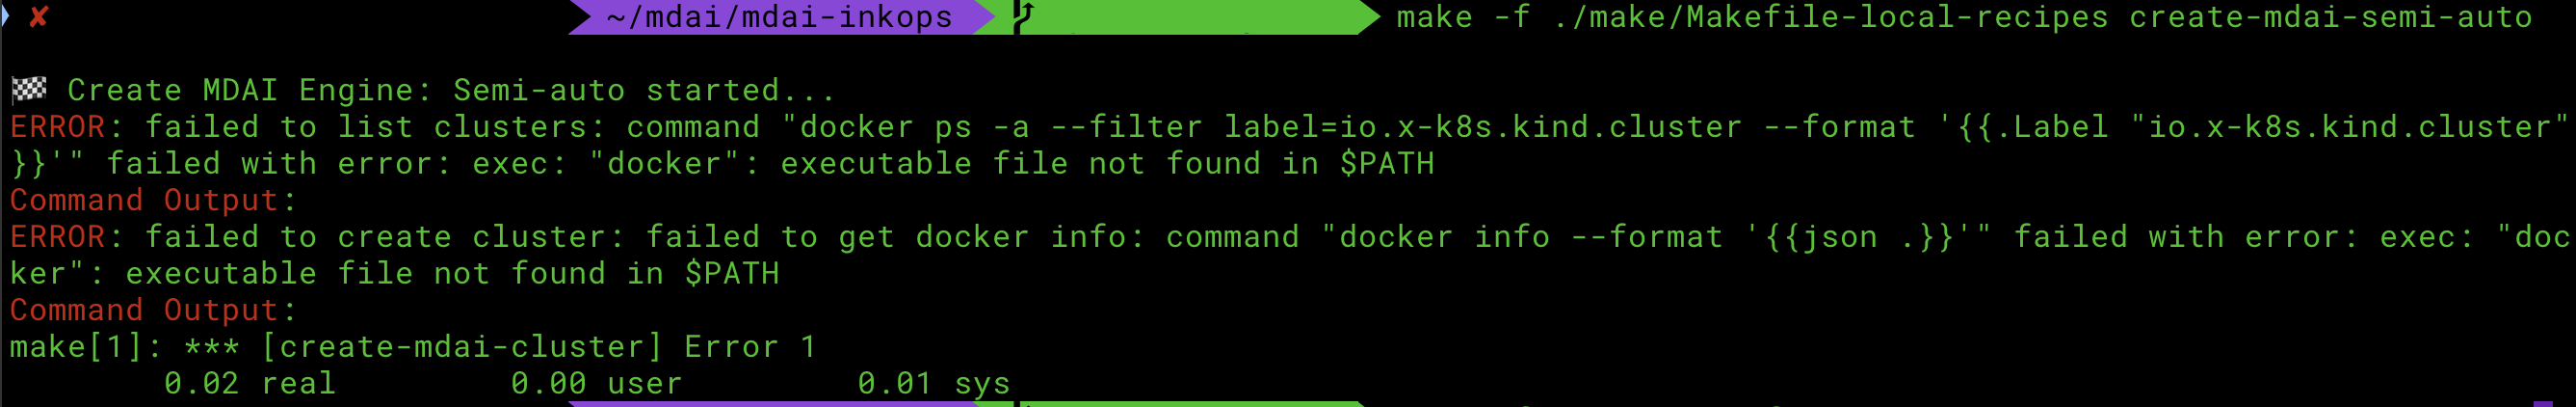
Docker daemon not started
Upon installation you encounter an error where Docker is the culprit, please ensure the docker daemon is running. Here's a helpful docker guide" to help resolve this issue.
An alternative to using the command line to start the Docker daemon is to open the Docker Desktop application.
This is an example of the error you would see during install related to the docker daemon.
Script timeout during automated install
This is an example of the error you would see during the automated install if there is a timeout.
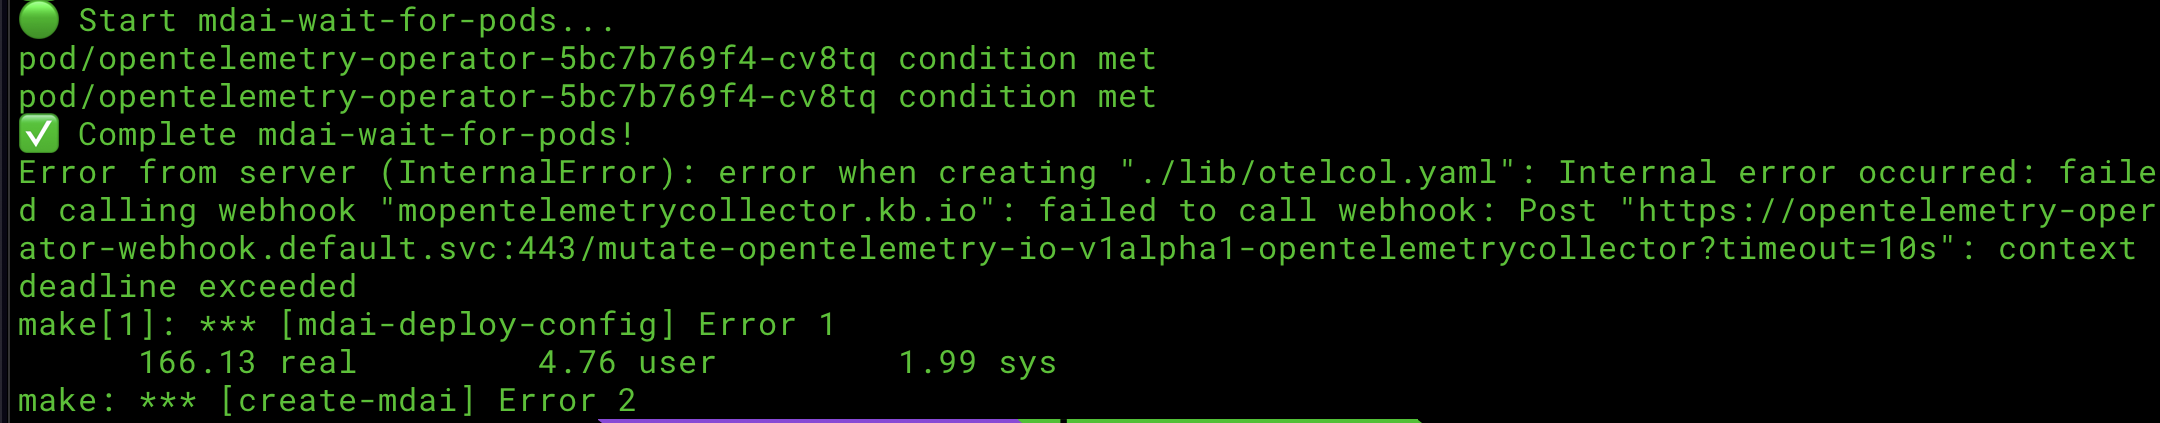
🤔 What can I do to fix it? ... It depends on where the error occurs during timeout. Let's investigate some potential fixes!
Option 1: Run a make target following a common breaking point
We've noticed the the typical timeout location is immediately following the ✅ Complete mdai-wait-for-pods! checkpoint. You should be able to run the following command to finish the install process.
make -f ./make/Makefile-local-install mdai-deploy-config
Option 2: Re-run the automated install process
If you errored out at a different checkpoint, try running the make -f ./make/Makefile-local-recipes create-mdai command again.
Option 3: Report an issue to us!
Still not working? Please report a new GitHub issue!
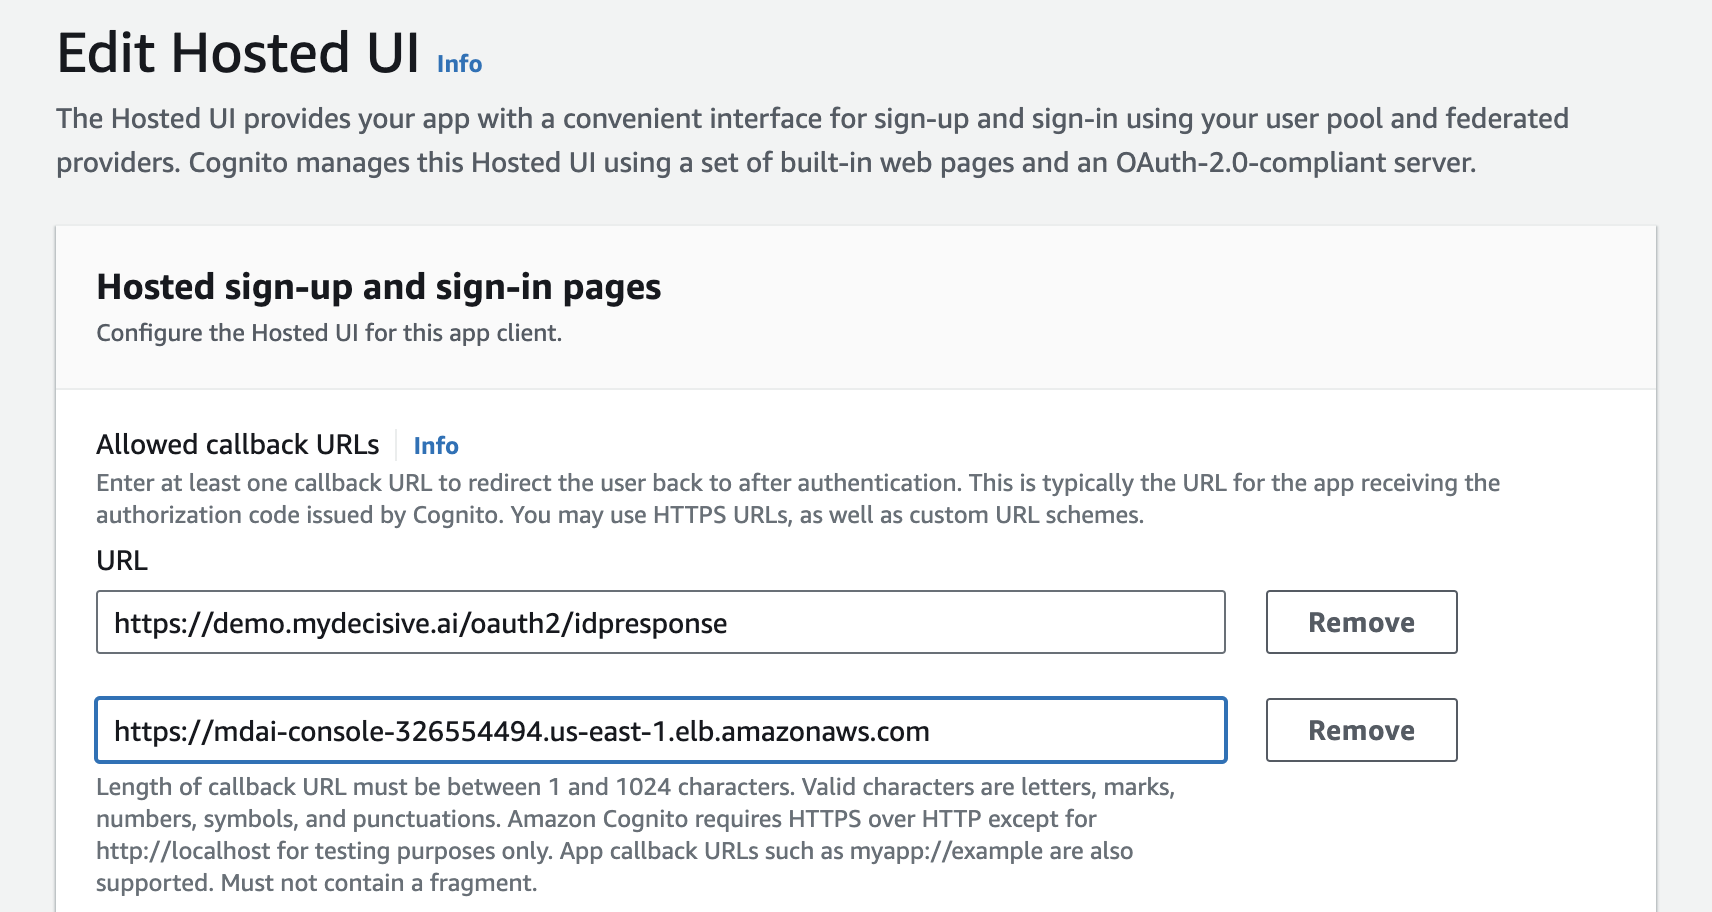
Cognito callback url not configured to your domain
This is an example of the error you would see during the automated install if there is a timeout.
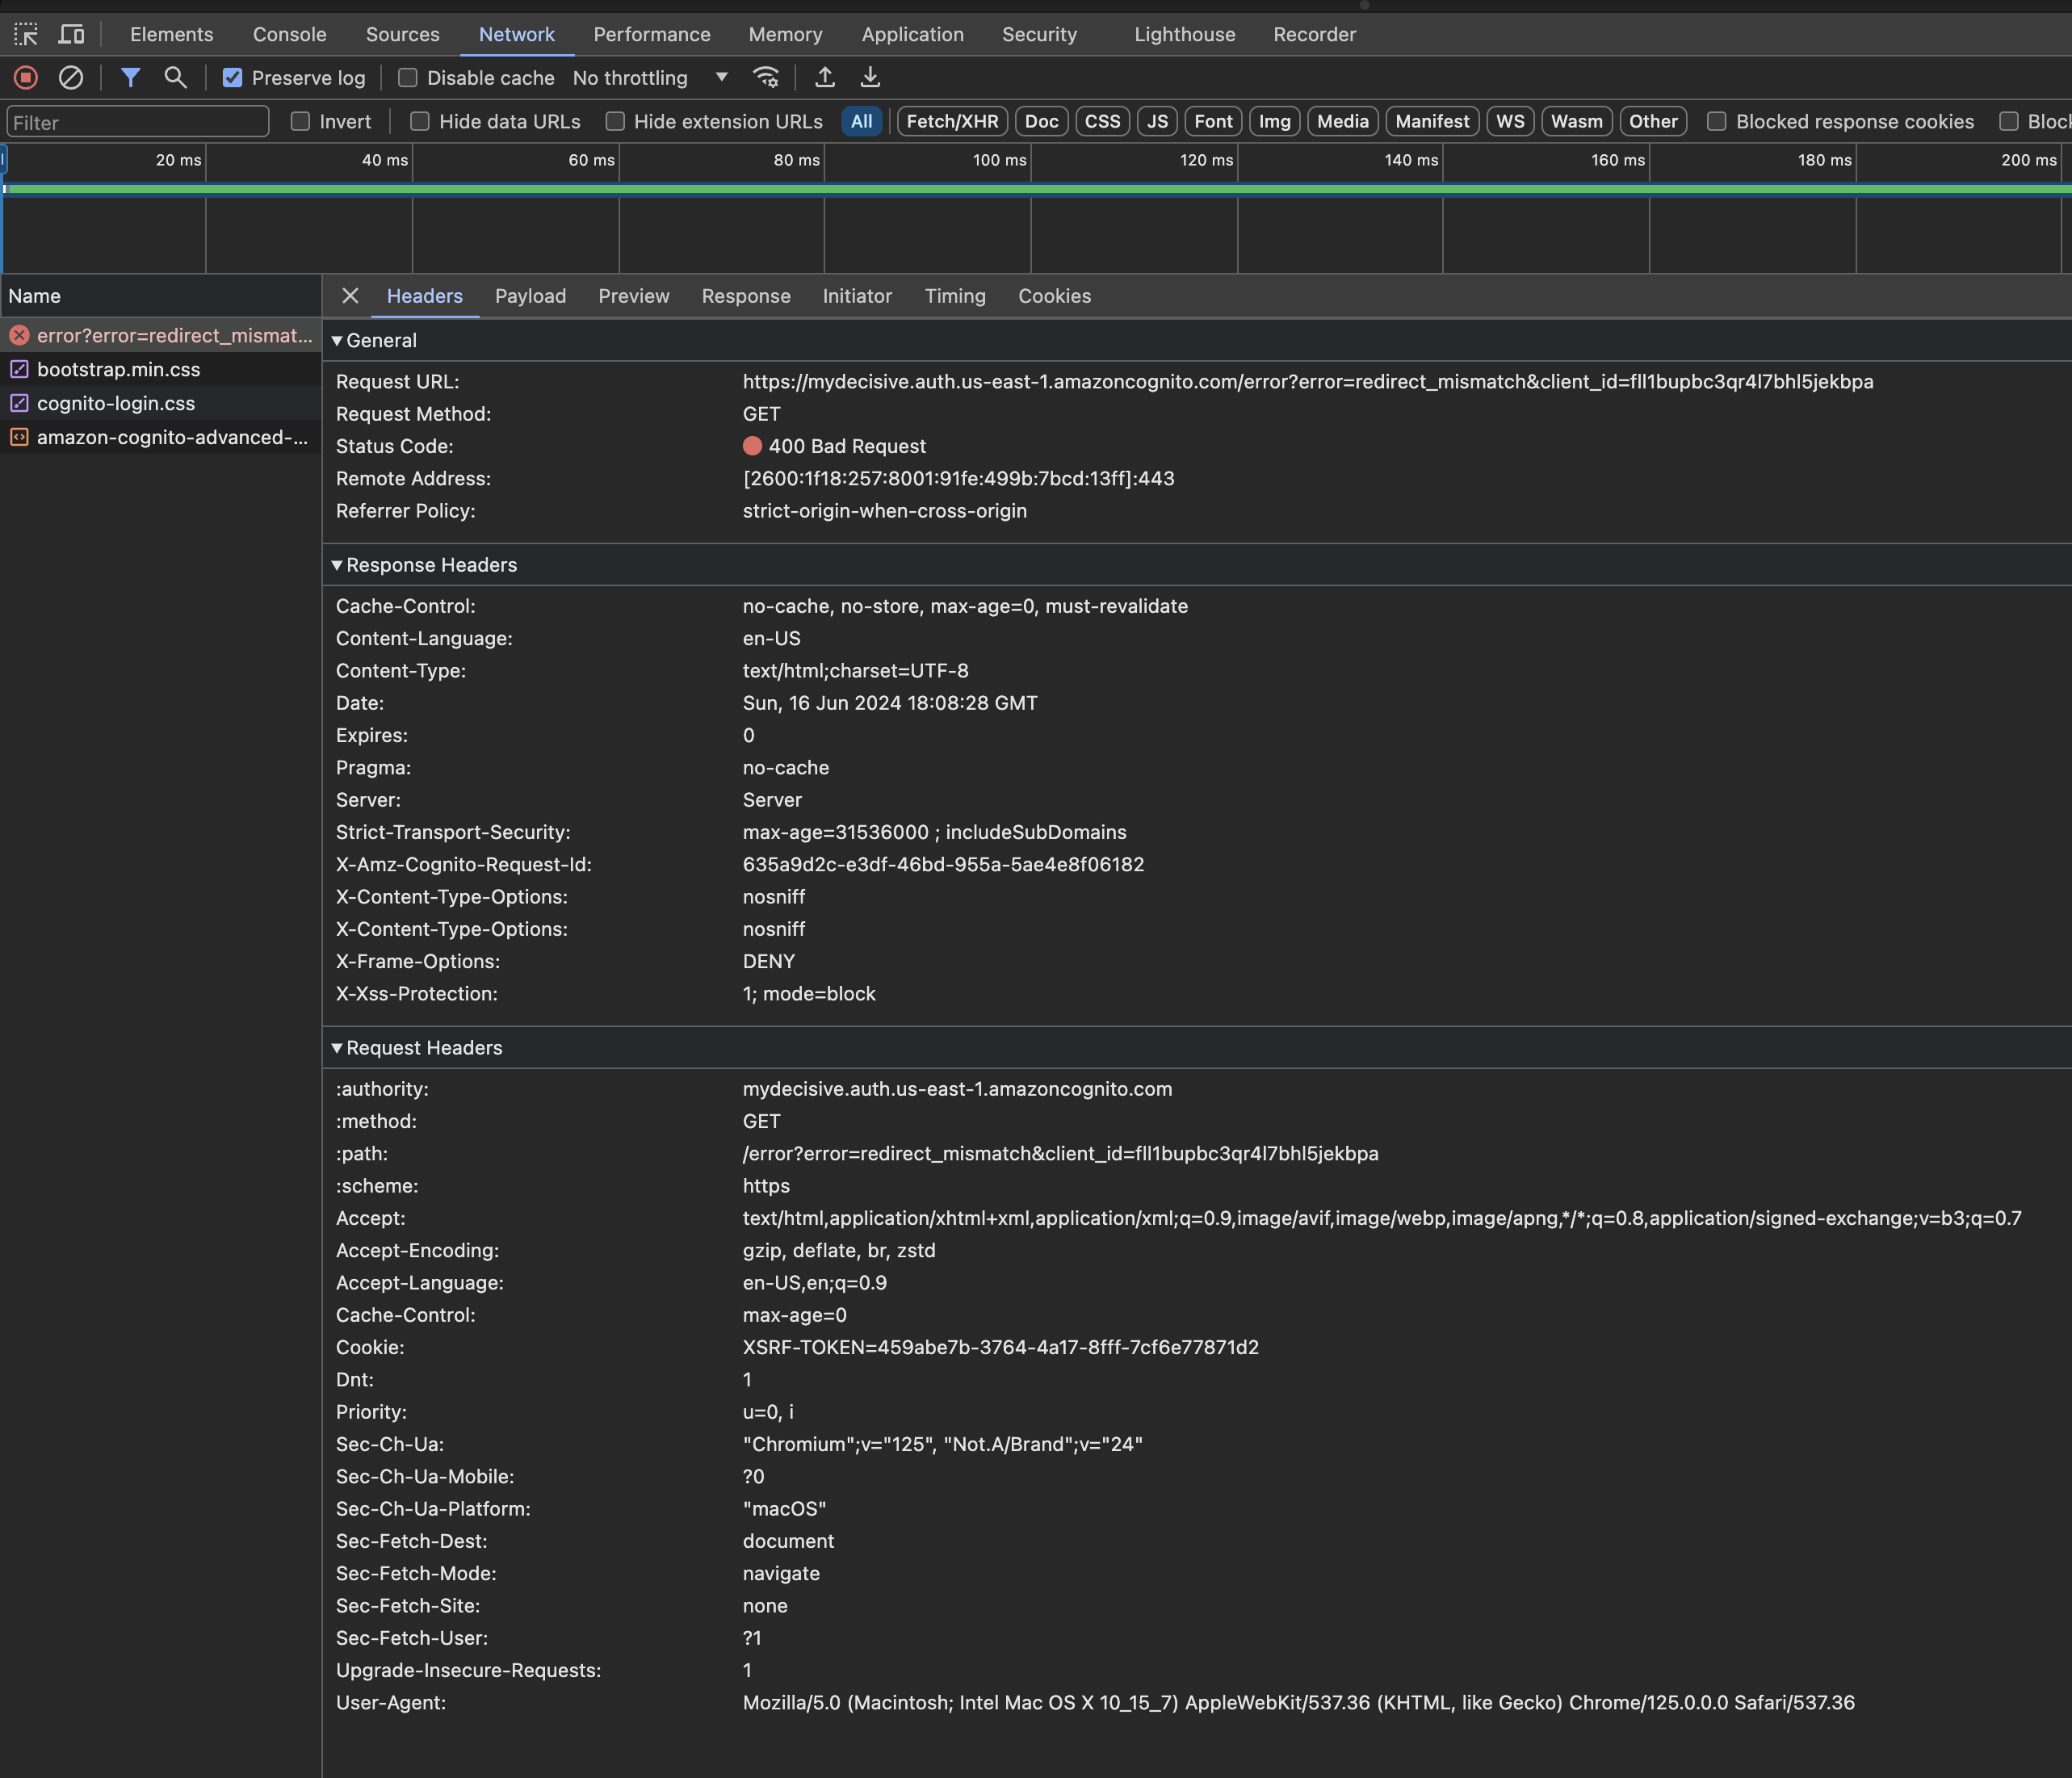
How to fix...
Option 1: Add your LB url as the callback url
Go to your AWS Cognito UserPool settings and add a callback url that represents your load balancer's URL.
Option 2: Create a CNAME record for your MDAI Console in your domain host.
Go to your host for your domain (e.g., GoDaddy) and add a CNAME record using your load balancer's DNS name to map to the key/value map for MDAI_UI_USER_POOL_DOMAIN you set in the aws.env file.
🔎 Report a new issue!
If this doesn't fix the error, feel free to:
- Email us at support@mydecisive.ai
- File an issue under the MDAI InkOps Project
Alpha Expectations
Warning: This is an Alpha release. This codebase is experimental and in active development. Proceed with caution and use at your own risk.
-
Limited Functionality: The alpha release will have limited functionality compared to the final product. Users should expect only basic features and capabilities to be available.
-
Experimental Features: Some features may be experimental or in early stages of development. Users should be aware that these features may change or be removed in future releases.
-
Bugs and Issues: Users should expect to encounter bugs, glitches, and issues while using the alpha release. They should be prepared to provide feedback and report any issues they encounter.
-
Incomplete Documentation: Documentation for the alpha release may be incomplete or missing entirely. Users should expect to rely on their own experimentation and troubleshooting skills to use the software effectively.
-
Limited Support: Support for the alpha release may be limited or non-existent. Users should not expect immediate assistance or troubleshooting help from the development team.
-
Data Loss or Corruption: Due to the experimental nature of the alpha release, there is a risk of data loss or corruption. Users should avoid using the software with critical or sensitive data.
-
Changes and Updates: The alpha release is a work in progress, and changes and updates are to be expected. Users should be prepared for frequent updates, changes to features, and improvements over time.
-
Community Engagement: Users are encouraged to provide feedback, suggestions, and bug reports to help improve the software. Community engagement and collaboration are essential for the success of the alpha release.
-
Testing and Evaluation: The alpha release is primarily intended for testing and evaluation purposes. Users should use the software to provide feedback on its usability, functionality, and performance.
-
No Guarantees: There are no guarantees or warranties associated with the alpha release. Users should use the software at their own risk and understand that it may not be suitable for production use.