Filter Logs


Infrastructure produces a tremendous volume of log data that then gets monitored, transmitted, analyzed, and stored. The cost to manage logs, in both time and resources, can be significant.
But not all logs are created equal. Now that we’re generating log data, let’s filter out unnecessary lines to reduce our volume. Using Prometheus, we found 2 very noisy services with log-data volumes we’d like to control. We can achieve that control using MDAI managed filters. These filters help our infrastructure monitor and react to data streams via configuration.
Using a Managed Filter
MDAI is monitoring services by a service identifier (log attribute), mdai_service, and a tolerance threshold over a rolling time window. When a given service surpasses that threshold, we’d like to drop non-critical data such as log lines with a level below WARN.
To do that, let’s add a managed filter to ./otel/otel_ref.yaml, the collector’s configuration file. Open the file for editing and look for the configuration block that looks like this:
    # filter/service_list:
    #   error_mode: ignore
    #   logs:
    #     log_record:
    #       - 'IsMatch(attributes["mdai_service"], "${env:SERVICE_LIST_REGEX}")'
Notice this block is currently commented out. Go ahead and uncomment it.
You will also need to uncomment the line in the following pipeline, filter processor instruction.
    logs/customer_pipeline:
        receivers: [ otlp, fluentforward ]
        processors: [
            # Uncomment the following line to start filtration
            # filter/service_list,  <---- UNCOMMENT THIS LINE
            # DO NOT CHANGE ORDER
            resource/observer_exporter_tag,
            groupbyattrs,
            memory_limiter,
            # DO NOT CHANGE ORDER
            # batch must be last in processor list
            batch
        ]
        exporters: [ debug, otlp/observer ]
Apply the updated configuration:
kubectl apply -f ./otel/otel_ref.yaml --namespace mdaiConfirm the Change in Log Volume
If the new filter is working, we should see a change in log volume. Go back to the Prometheus expression dashboard to see what’s happening with the services we’re tracking. The graph should show a major change.
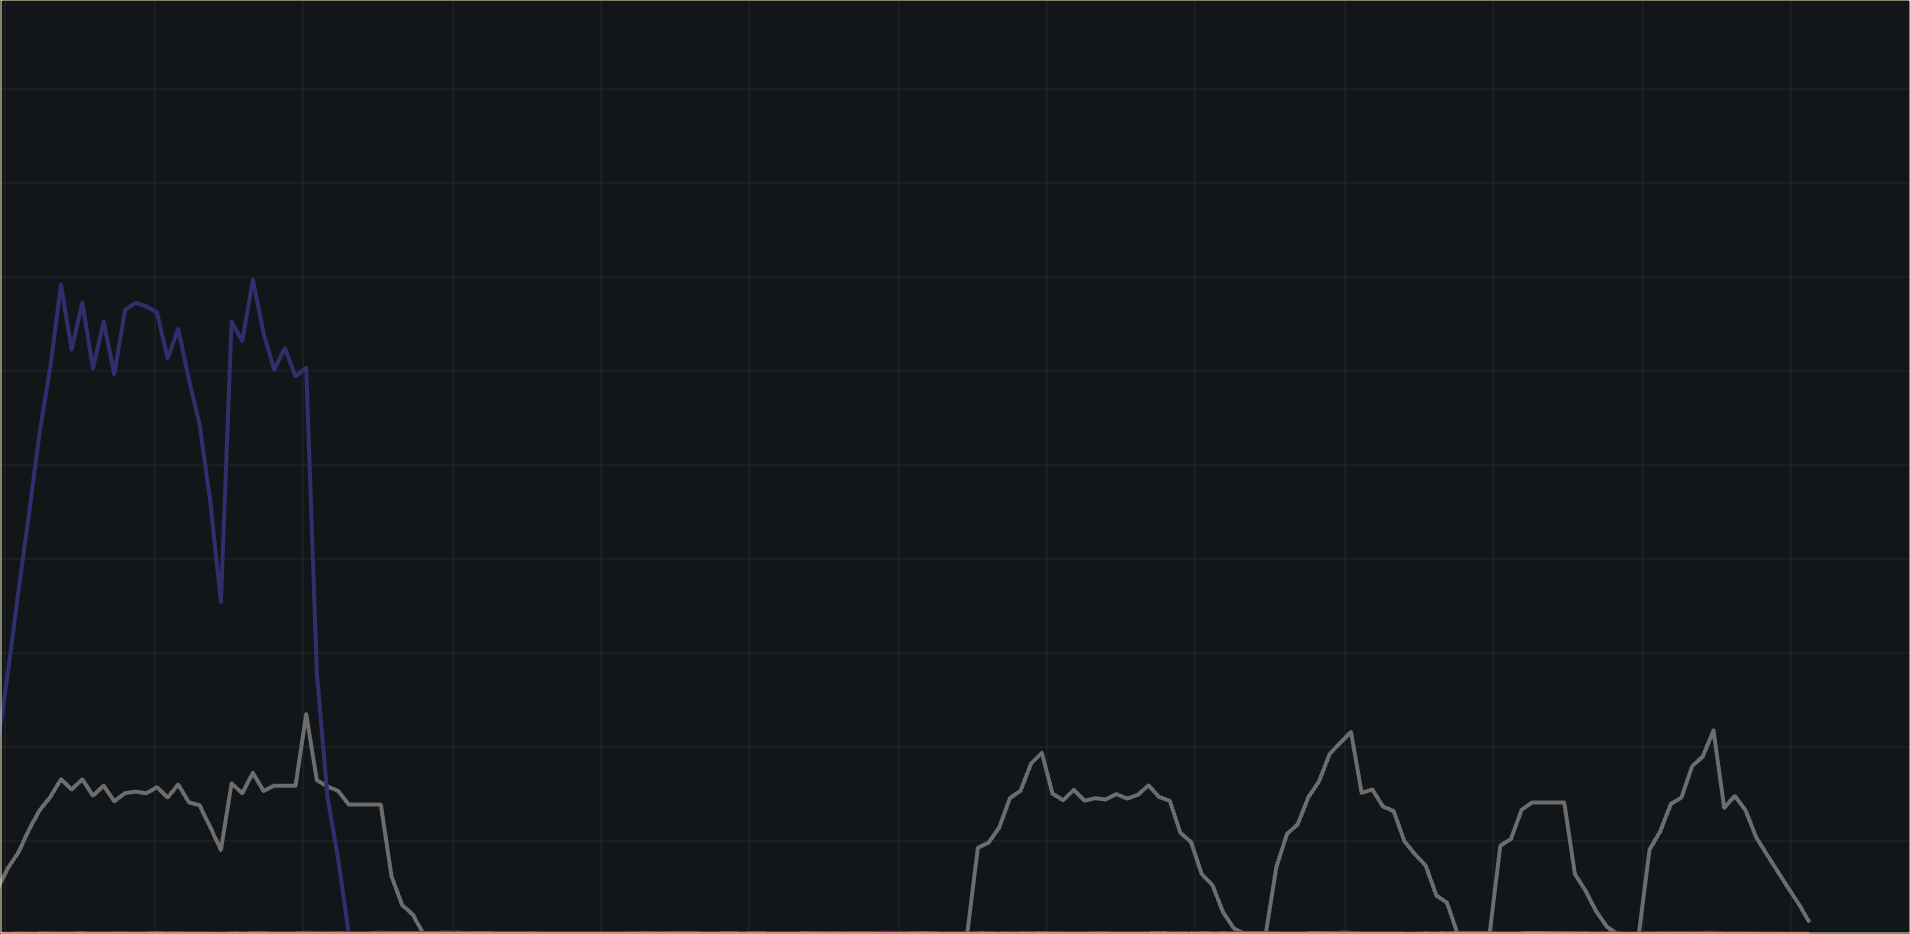
The log volume for service4321 has decreased so much that it’s not visible at the scale shown. And if you keep watching the dashboard, you’ll see that log volume for service4321 isn’t coming back. Let’s review what this graph is telling us:
We filtered out log lines that have the INFO log level and those make up the bulk of the
service4321logs. Therefore we expect not to see that service in the graph any longer.service1234logs had much fewer INFO log lines, and it generated a substantial amount of log lines at the WARNING and ERROR levels. Those levels are not being dropped. That’s good, sinceservice1234is letting us know that it needs attention!Other services had low volumes of logs, and shouldn’t be visibly affected by the filter.
🎉 Success
Thanks for sticking around. To emphasize the power of what you completed, let’s recap what happened…
- You setup a bare-bones cluster to install MDAI
- You installed the MDAI helm repo (all MDAI dependencies)
- You installed an instance of the MDAI Smart Telemetry H
- You installed a few log generators that created synthetic data to simulate telemetry flow from your services/infra to MDAI
- You setup an OTel collector for ETL + routing activities
- You setup a log forwarder to capture the log streams from the log generators and forward on to your OTel collector
- You applied a data filter in your OTel collector
- You successfully filtered data – which at the end of the day in a prod environment, would provide cost savings.