Set Up a Dashboard


Dashboards are an indispensable devops tool providing alerts, enhancing visibility, enabling analysis, and more.
We’ll use Prometheus and Grafana, which were installed along with MDAI, to inspect the log data that’s flowing through the pipeline we created. Prometheus is collecting and aggregating the data, while Grafana allows us to visualize that data and create alerts in a dashboard.
Port Forward Prometheus and Grafana
Port-forward Prometheus so you can connect to the Prometheus instance running on your local machine.
kubectl port-forward -n mdai svc/kube-prometheus-stack-prometheus 9090:9090Do the same with Grafana.
kubectl port-forward -n mdai svc/mdai-grafana 3000:80Connect to Grafana
The MDAI Grafana dashboards shows summaries of cluster usage, runtime metrics, and more. Log in with the username admin and the password mdai.
Note: WE have documented our dashboards individually. We go into further detail in our Grafana Dashboards page. These documents are rapidly changing, so we do not guarantee accuracy. If you have questions, please raise a Slack message in our #mdai-docs-questions Slack Channel
Connect to the Prometheus Dashboard
Use the Prometheus expression dashboard to run queries against the data you’re collecting.
You can use PromQL to query the data flowing through the pipeline we created. For example, run this query to see the amount of logs that each of the synthetic services is sending:
sum by (mdai_service) (increase(bytes_received_by_service_total[6m]))A graph similar to the following should appear.
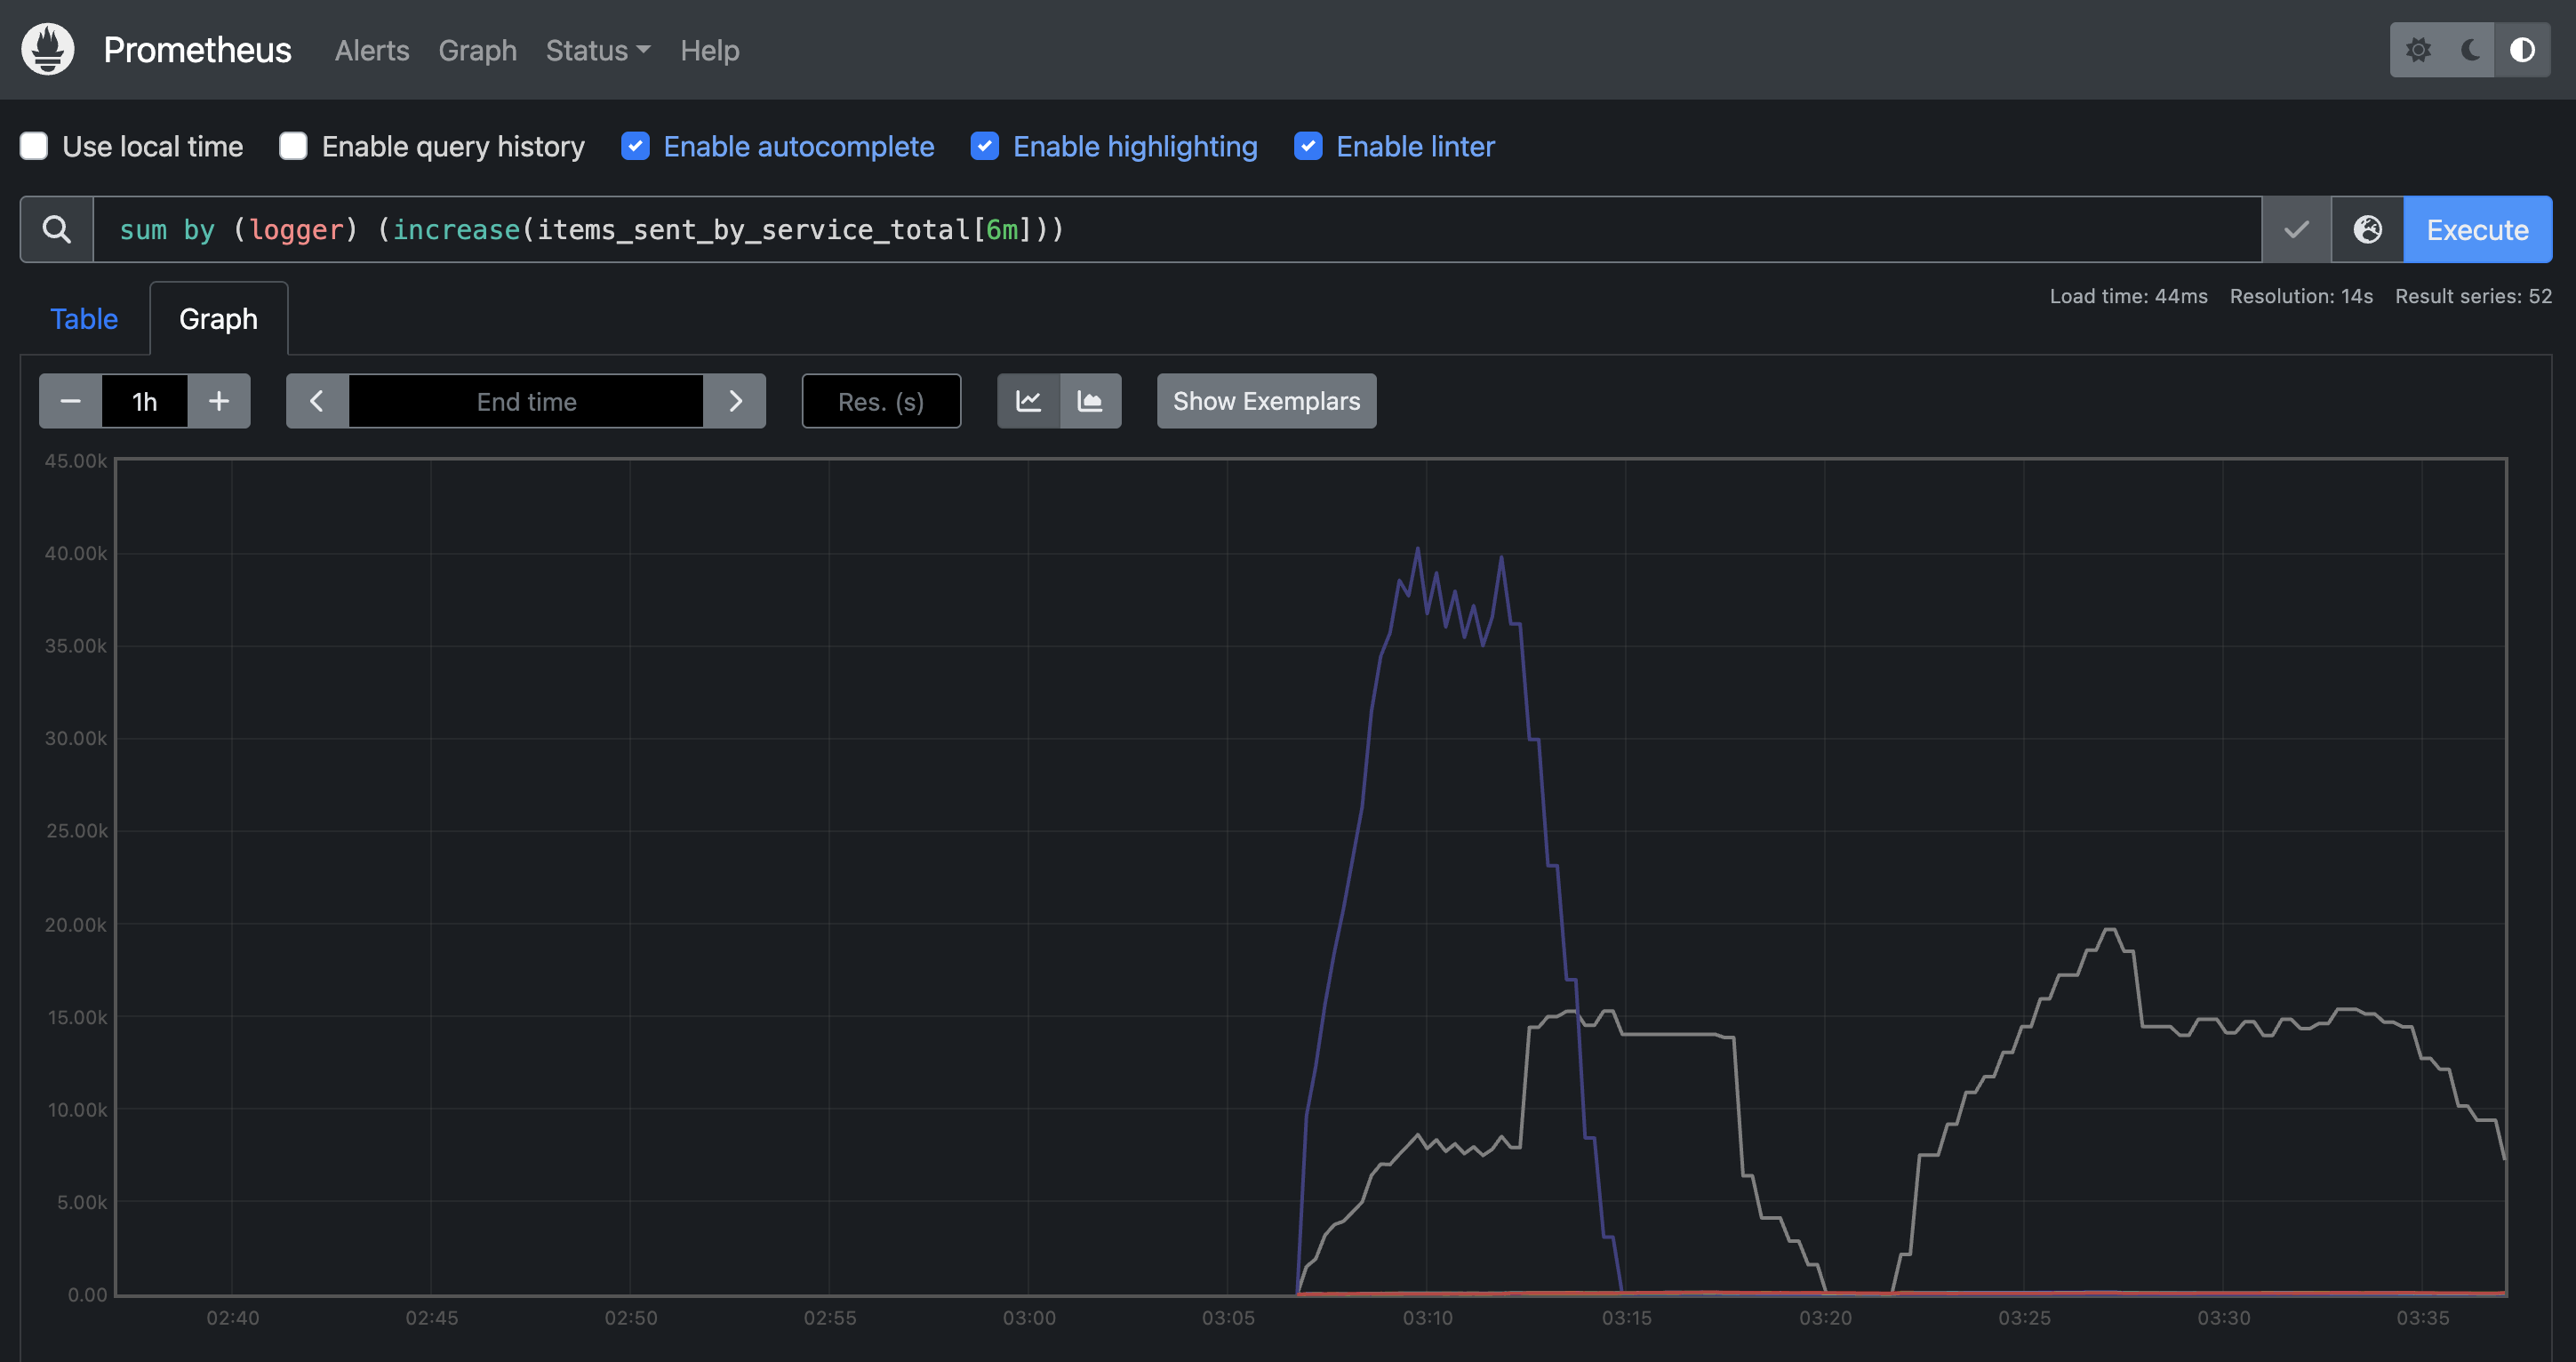
Notice that the volumes of services service4321 and service1234 are well above the others. To see that more clearly, scroll down to show the list of services below the chart, then click one of the other services (for example, service1).
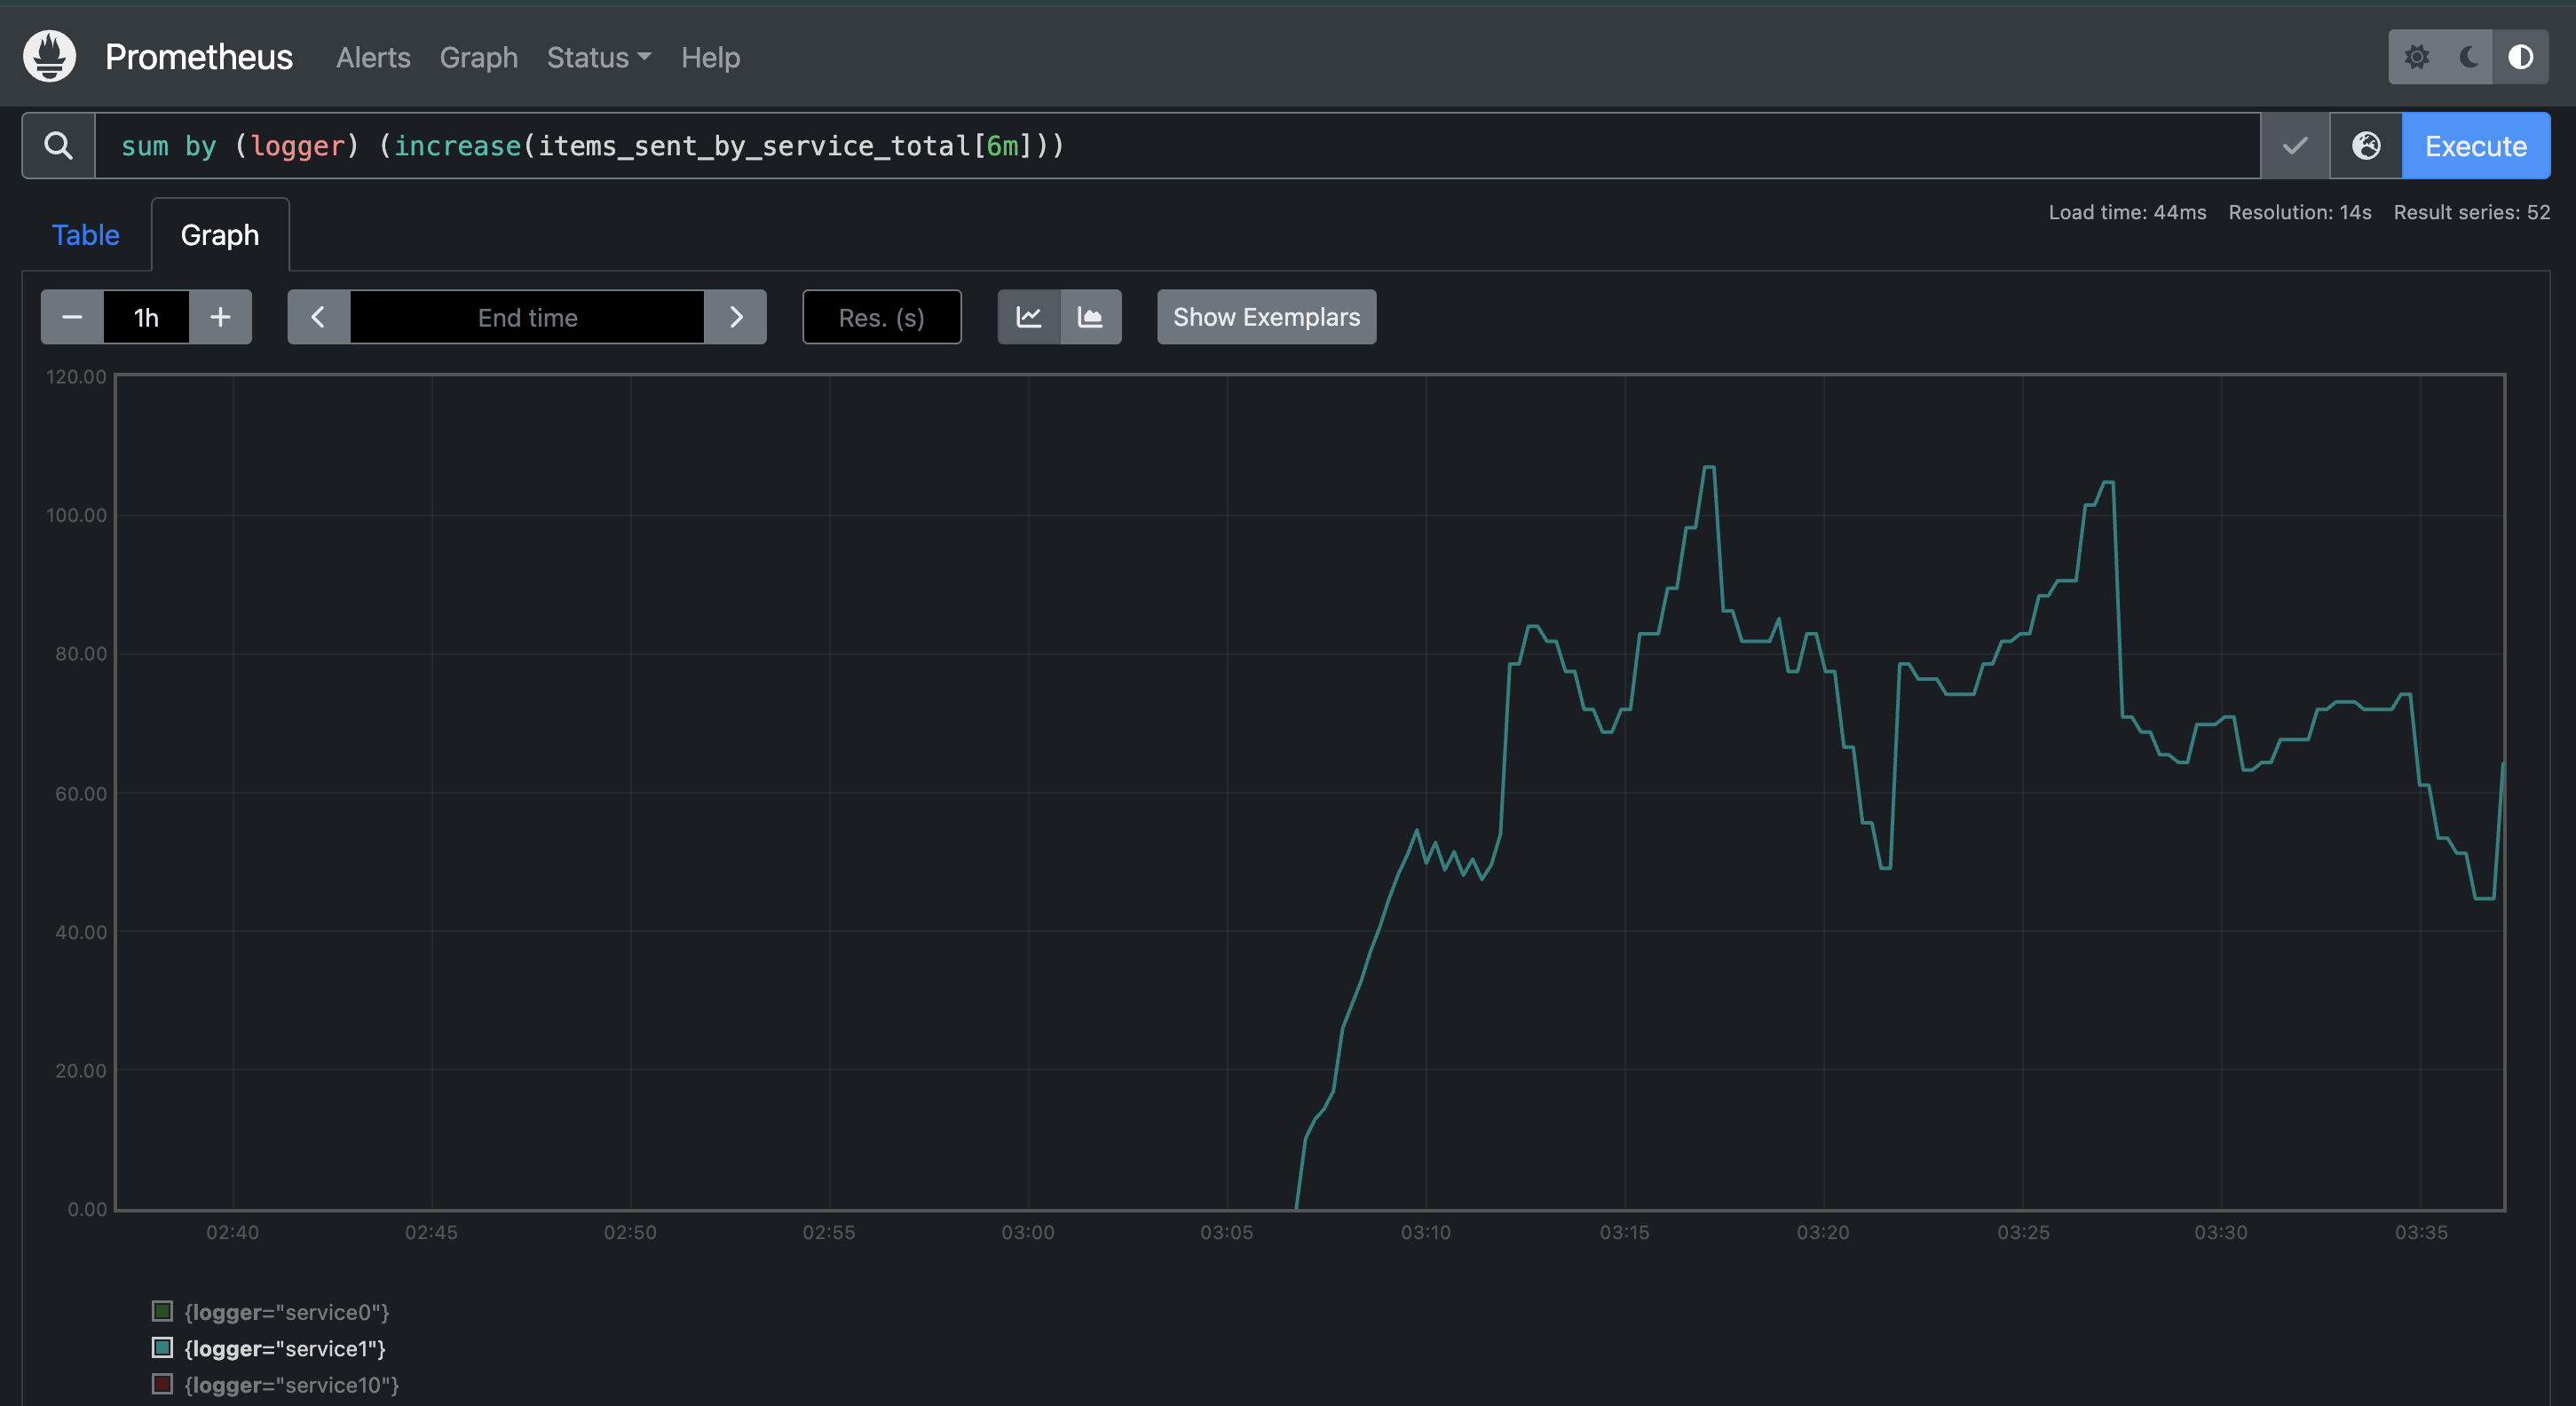
Notice that the change in scale on the graph is in orders of magnitude.
Investigate the Noisy Services
We need to see what kind of logs the 2 noisy services are generating before formulating a plan to dampen their output.
The noisy log generators are responsible for the noisy services, so let’s check one of them. Substitute the name of one of your a noisy loggers in the following command.
kubectl logs -n mdai mdai-logger-noisy-77fcbf8b9f-fj2lsThe output shows mixed levels for the log lines of service1234.
2025-05-30T00:36:26+00:00 - service1234 - teamA - us-east-1 - ERROR - The algorithm failed to execute. Error code 00x00.
2025-05-30T00:36:26+00:00 - service1234 - teamA - us-east-1 - INFO - The algorithm successfully executed, triggering neural pathways and producing a burst of optimized data streams.
2025-05-30T00:36:26+00:00 - service1234 - teamA - us-east-1 - WARNING - Getting hot in here.
2025-05-30T00:36:26+00:00 - service1234 - teamA - us-east-1 - INFO - The algorithm successfully executed, triggering neural pathways and producing a burst of optimized data streams.
2025-05-30T00:36:26+00:00 - service1234 - teamA - us-east-1 - ERROR - The algorithm failed to execute. Error code 00x00.
2025-05-30T00:36:26+00:00 - service1234 - teamA - us-east-1 - WARNING - Getting hot in here.
2025-05-30T00:36:26+00:00 - service1234 - teamA - us-east-1 - ERROR - The algorithm failed to execute. Error code 00x00.
2025-05-30T00:36:26+00:00 - service1234 - teamA - us-east-1 - WARNING - Getting hot in here.
2025-05-30T00:36:26+00:00 - service1234 - teamA - us-east-1 - ERROR - The algorithm failed to execute. Error code 00x00.
2025-05-30T00:36:26+00:00 - service1234 - teamA - us-east-1 - INFO - The algorithm successfully executed, triggering neural pathways and producing a burst of optimized data streams.
2025-05-30T00:36:26+00:00 - service1234 - teamA - us-east-1 - ERROR - The algorithm failed to execute. Error code 00x00.
2025-05-30T00:36:26+00:00 - service1234 - teamA - us-east-1 - WARNING - Getting hot in here.
2025-05-30T00:36:26+00:00 - service1234 - teamA - us-east-1 - WARNING - Getting hot in here.
2025-05-30T00:36:26+00:00 - service1234 - teamA - us-east-1 - ERROR - The algorithm failed to execute. Error code 00x00.
2025-05-30T00:36:26+00:00 - service1234 - teamA - us-east-1 - ERROR - The algorithm failed to execute. Error code 00x00.
2025-05-30T00:36:26+00:00 - service1234 - teamA - us-east-1 - INFO - The algorithm successfully executed, triggering neural pathways and producing a burst of optimized data streams.
Now let’s check one of the extra noisy ones.
kubectl logs -n mdai mdai-logger-xnoisy-686cb6465f-lg5gdThe output shows that the level of the vast majority of log lines for service4321 is INFO.
2025-05-29T07:27:52+00:00 - service4321 - teamB - us-east-1 - INFO - The algorithm successfully executed, triggering neural pathways and producing a burst of optimized data streams.
2025-05-29T07:27:52+00:00 - service4321 - teamB - us-east-1 - INFO - The algorithm successfully executed, triggering neural pathways and producing a burst of optimized data streams.
2025-05-29T07:27:52+00:00 - service4321 - teamB - us-east-1 - INFO - The algorithm successfully executed, triggering neural pathways and producing a burst of optimized data streams.
2025-05-29T07:27:52+00:00 - service4321 - teamB - us-east-1 - INFO - The algorithm successfully executed, triggering neural pathways and producing a burst of optimized data streams.
2025-05-29T07:27:52+00:00 - service4321 - teamB - us-east-1 - INFO - The algorithm successfully executed, triggering neural pathways and producing a burst of optimized data streams.
2025-05-29T07:27:52+00:00 - service4321 - teamB - us-east-1 - INFO - The algorithm successfully executed, triggering neural pathways and producing a burst of optimized data streams.
2025-05-29T07:27:52+00:00 - service4321 - teamB - us-east-1 - ERROR - The algorithm failed to execute. Error code 00x00.
2025-05-29T07:27:52+00:00 - service4321 - teamB - us-east-1 - INFO - The algorithm successfully executed, triggering neural pathways and producing a burst of optimized data streams.
2025-05-29T07:27:52+00:00 - service4321 - teamB - us-east-1 - INFO - The algorithm successfully executed, triggering neural pathways and producing a burst of optimized data streams.
2025-05-29T07:27:52+00:00 - service4321 - teamB - us-east-1 - INFO - The algorithm successfully executed, triggering neural pathways and producing a burst of optimized data streams.
2025-05-29T07:27:52+00:00 - service4321 - teamB - us-east-1 - INFO - The algorithm successfully executed, triggering neural pathways and producing a burst of optimized data streams.
2025-05-29T07:27:52+00:00 - service4321 - teamB - us-east-1 - INFO - The algorithm successfully executed, triggering neural pathways and producing a burst of optimized data streams.
2025-05-29T07:27:52+00:00 - service4321 - teamB - us-east-1 - INFO - The algorithm successfully executed, triggering neural pathways and producing a burst of optimized data streams.
2025-05-29T07:27:52+00:00 - service4321 - teamB - us-east-1 - INFO - The algorithm successfully executed, triggering neural pathways and producing a burst of optimized data streams.
2025-05-29T07:27:52+00:00 - service4321 - teamB - us-east-1 - INFO - The algorithm successfully executed, triggering neural pathways and producing a burst of optimized data streams.
2025-05-29T07:27:52+00:00 - service4321 - teamB - us-east-1 - INFO - The algorithm successfully executed, triggering neural pathways and producing a burst of optimized data streams.
2025-05-29T07:27:52+00:00 - service4321 - teamB - us-east-1 - INFO - The algorithm successfully executed, triggering neural pathways and producing a burst of optimized data streams.
2025-05-29T07:27:52+00:00 - service4321 - teamB - us-east-1 - INFO - The algorithm successfully executed, triggering neural pathways and producing a burst of optimized data streams.
2025-05-29T07:27:52+00:00 - service4321 - teamB - us-east-1 - INFO - The algorithm successfully executed, triggering neural pathways and producing a burst of optimized data streams.
Our systems are generating a great deal of INFO log lines. We want to know when things are about to go wrong (WARNING), or when they’ve actually gone wrong (ERROR), but knowing that services are performing as expected (INFO) isn’t worth paying for in our use case.
Success
Now that we’ve found 2 noisy services, our next task is to apply a filter to remove the noise.