Dynamic Data Filtration
Use case
Filter telemetry streams in real time using dynamic rules that adapt to services, environments, or cost constraints—without code changes or redeploys.
Prerequisites
- A k8s cluster where
mdaican be installed - Clone the mdai-labs GitHub repo
Choose your preferred self-guided experience
Data Filtration flow
Overview
Let’s get started with the basics
To achieve control your Data Filtration pipelines, you’ll need to…
- Create a synthetic log stream that forwards data to your collector
- Create an OpenTelemetry collector to connect your data sources to destinations
- Create an MdaiHub to create dynamic control your data streams
Let’s get started with the basics
Step 1. Introduce OTel and MdaiHub into your cluster
Provision resources for your Data Filtration pipeline
Run the following command an you’ll deploy mock data, otel, and an MDAI Hub
mdai use-case data_filtration --version 0.8.6 --workflow basicProvision synthetic data streams that represent your services
Separately, install a fluentD instance to forward your synthetic log streams to the OTel collector.
You’ll now see traffic flowing through to the collector from the synthetic services.
service1-service1000- Normal logging from these servicesservice1234- A noisy serviceservice4321- A super noisy service
helm upgrade --install --repo https://fluent.github.io/helm-charts fluent fluentd -f ./mock-data/configs/loggen_fluent.yamlValidate dataflow with Grafana
admin / mdaiNote: It may take a few minutes for data to start showing up in the dashboards.
kubectl port-forward -n mdai svc/mdai-grafana 3000:80Navigate to the OTel Dataflow Dashboard
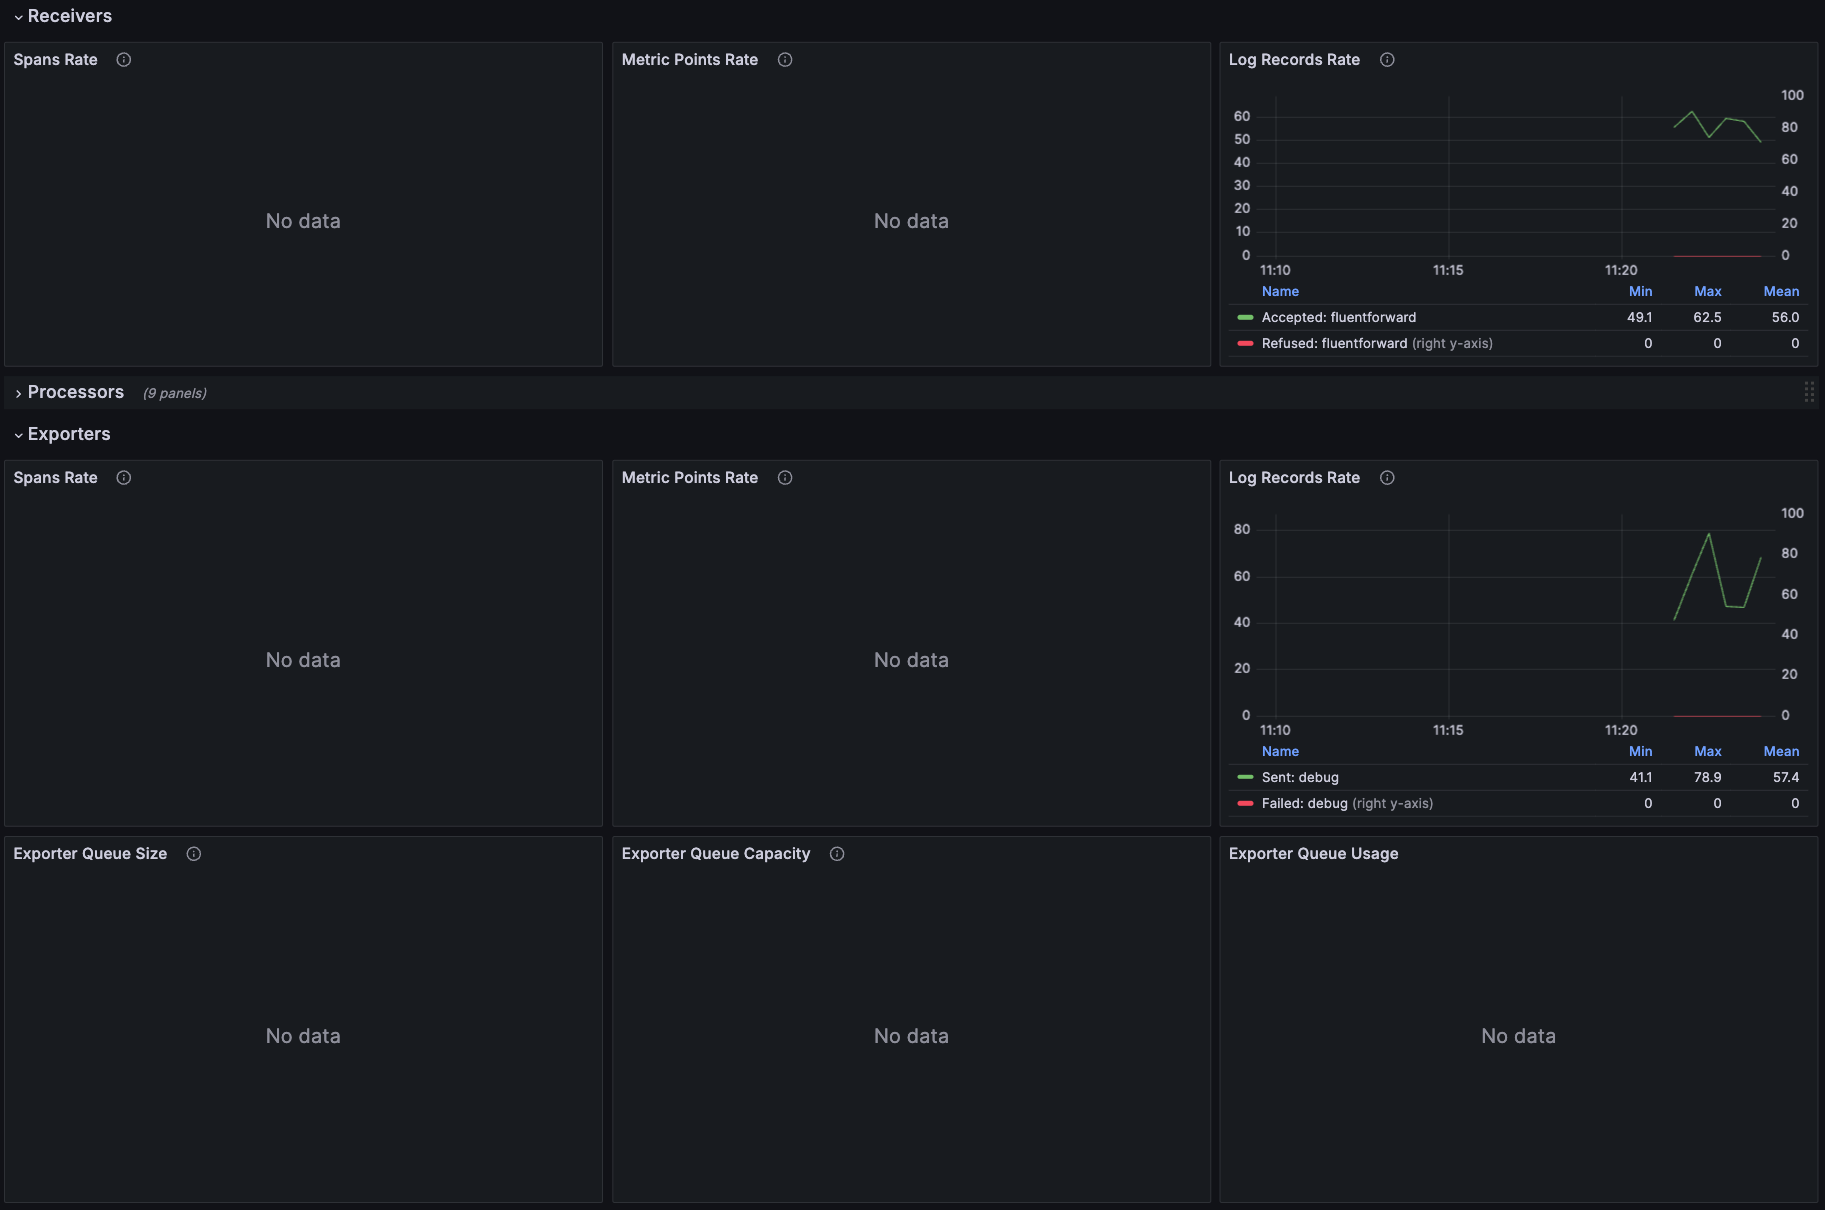
You should see a consistent stream of data and a 1:1 ratio of logs received : logs exported
Step 2. Use mdai recipe to statically achieve use case
Apply static routing
Update your collector to utilize static routing.
mdai use_case data_filtration --version 0.8.6 --workflow staticValidate dataflow with Grafana
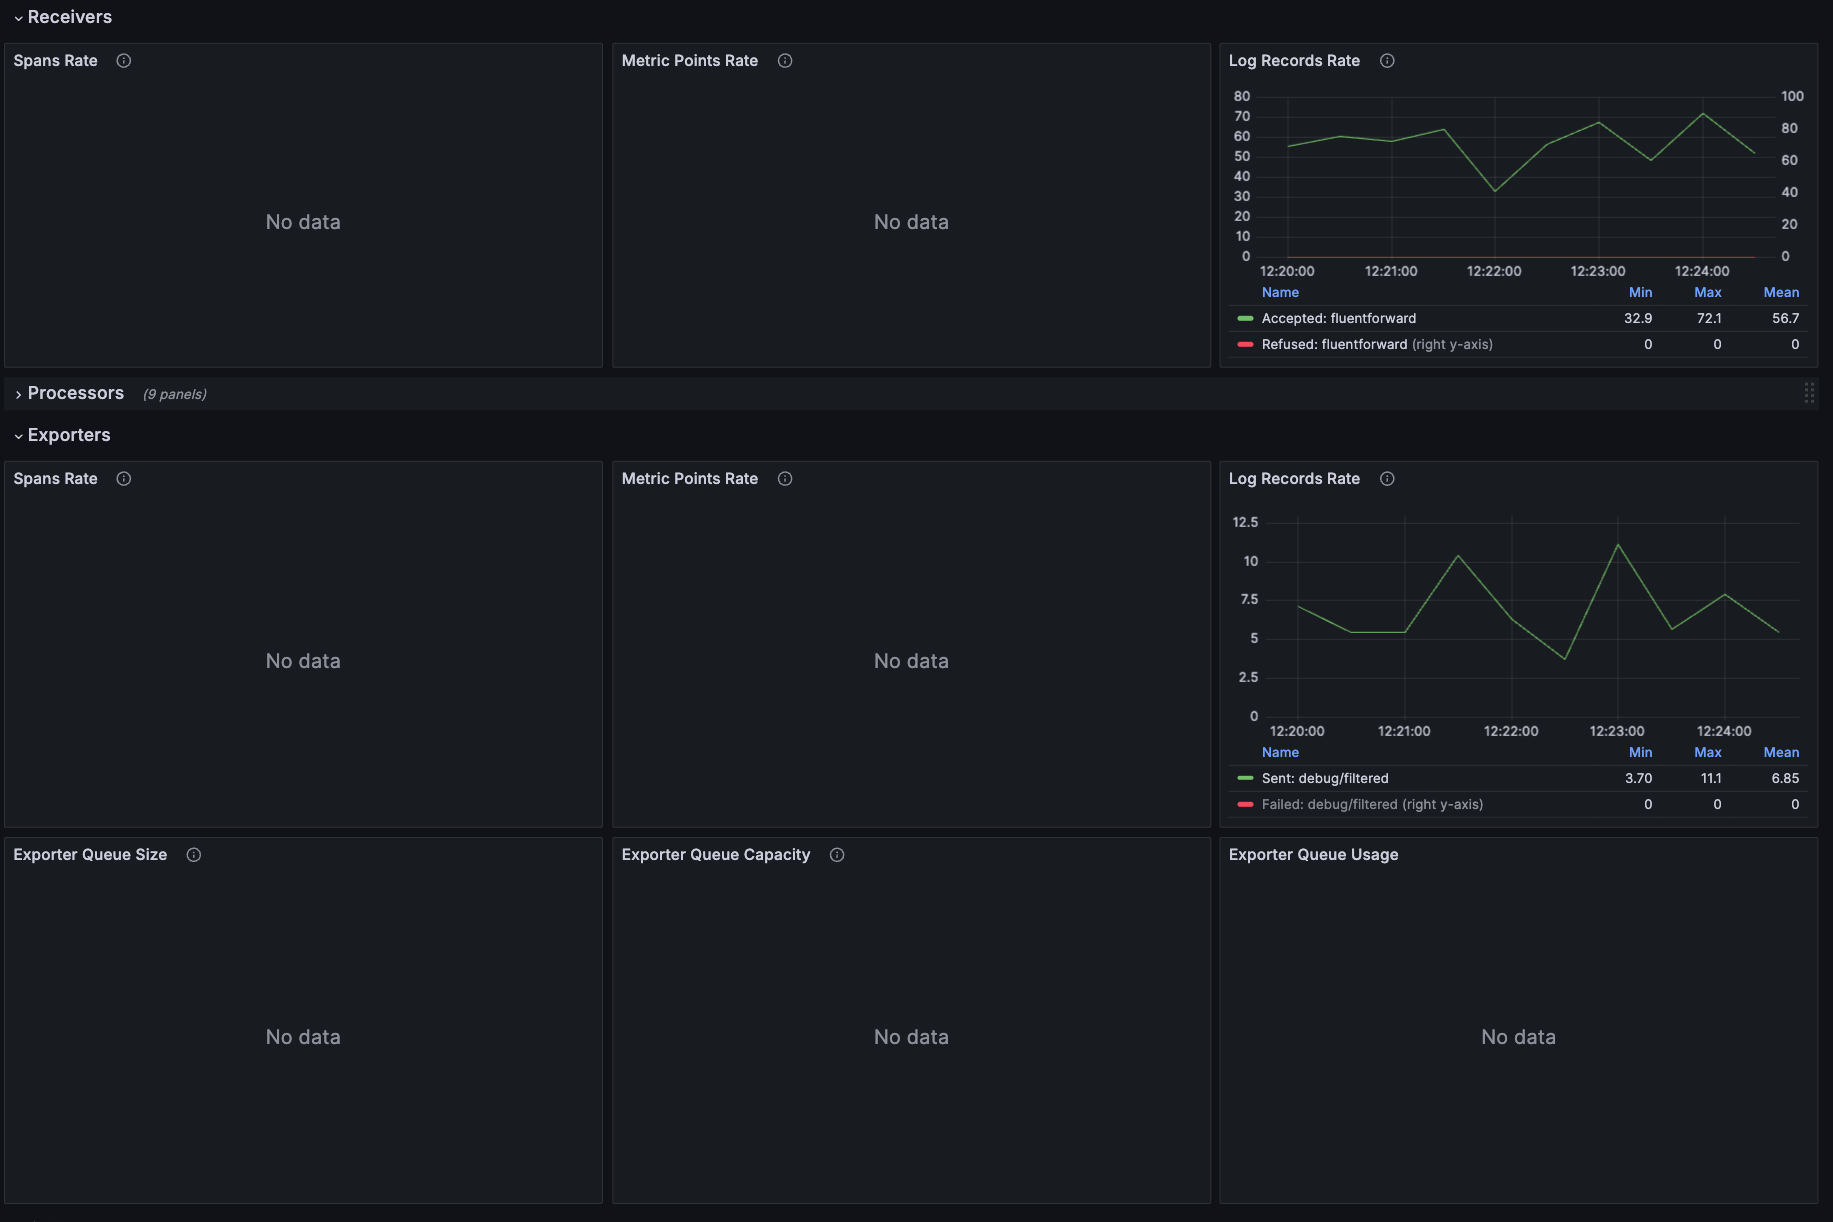
Navigate to the OTel Dataflow Dashboard
You should see that your log stream no longer sends the 1:1 ratio and has decreased the amount exported.
Step 3. Use MyDecisive to parameterize achieve use case
Apply static routing
Update your collector to utilize static routing.
mdai use_case data_filtration --version 0.8.6 --workflow dynamicProvision an observer
mdai apply ./0.8.6/use_cases/data_filtration/dynamic/observer.yaml -n mdaiStep 4. Validate dynamic filtration
Validate dataflow with Grafana
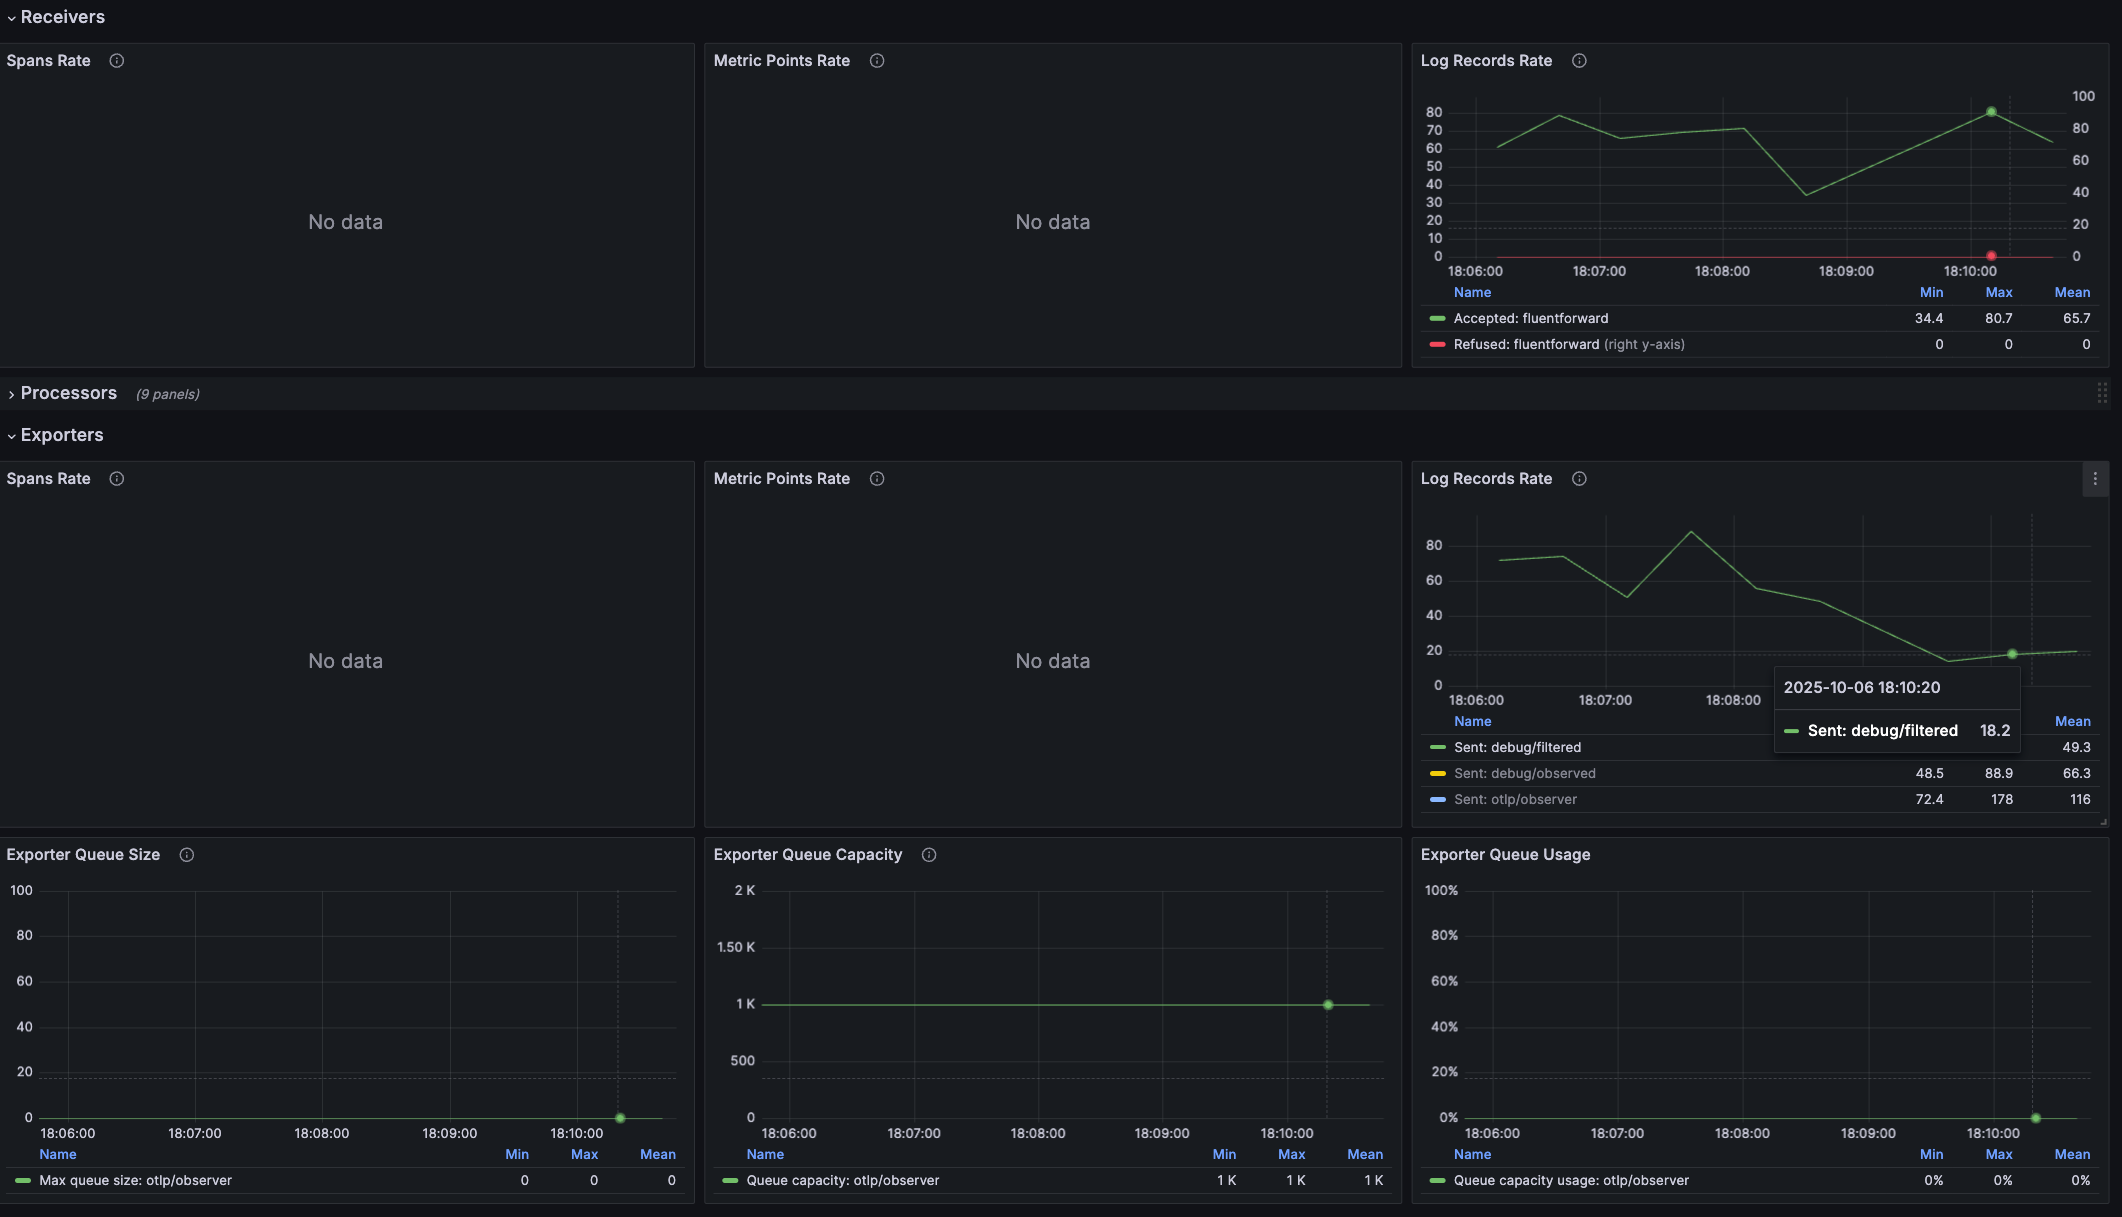
Navigate to the OTel Dataflow Dashboard
Before you ran new configs, your export volume was relatively high and costly with your noisy services.
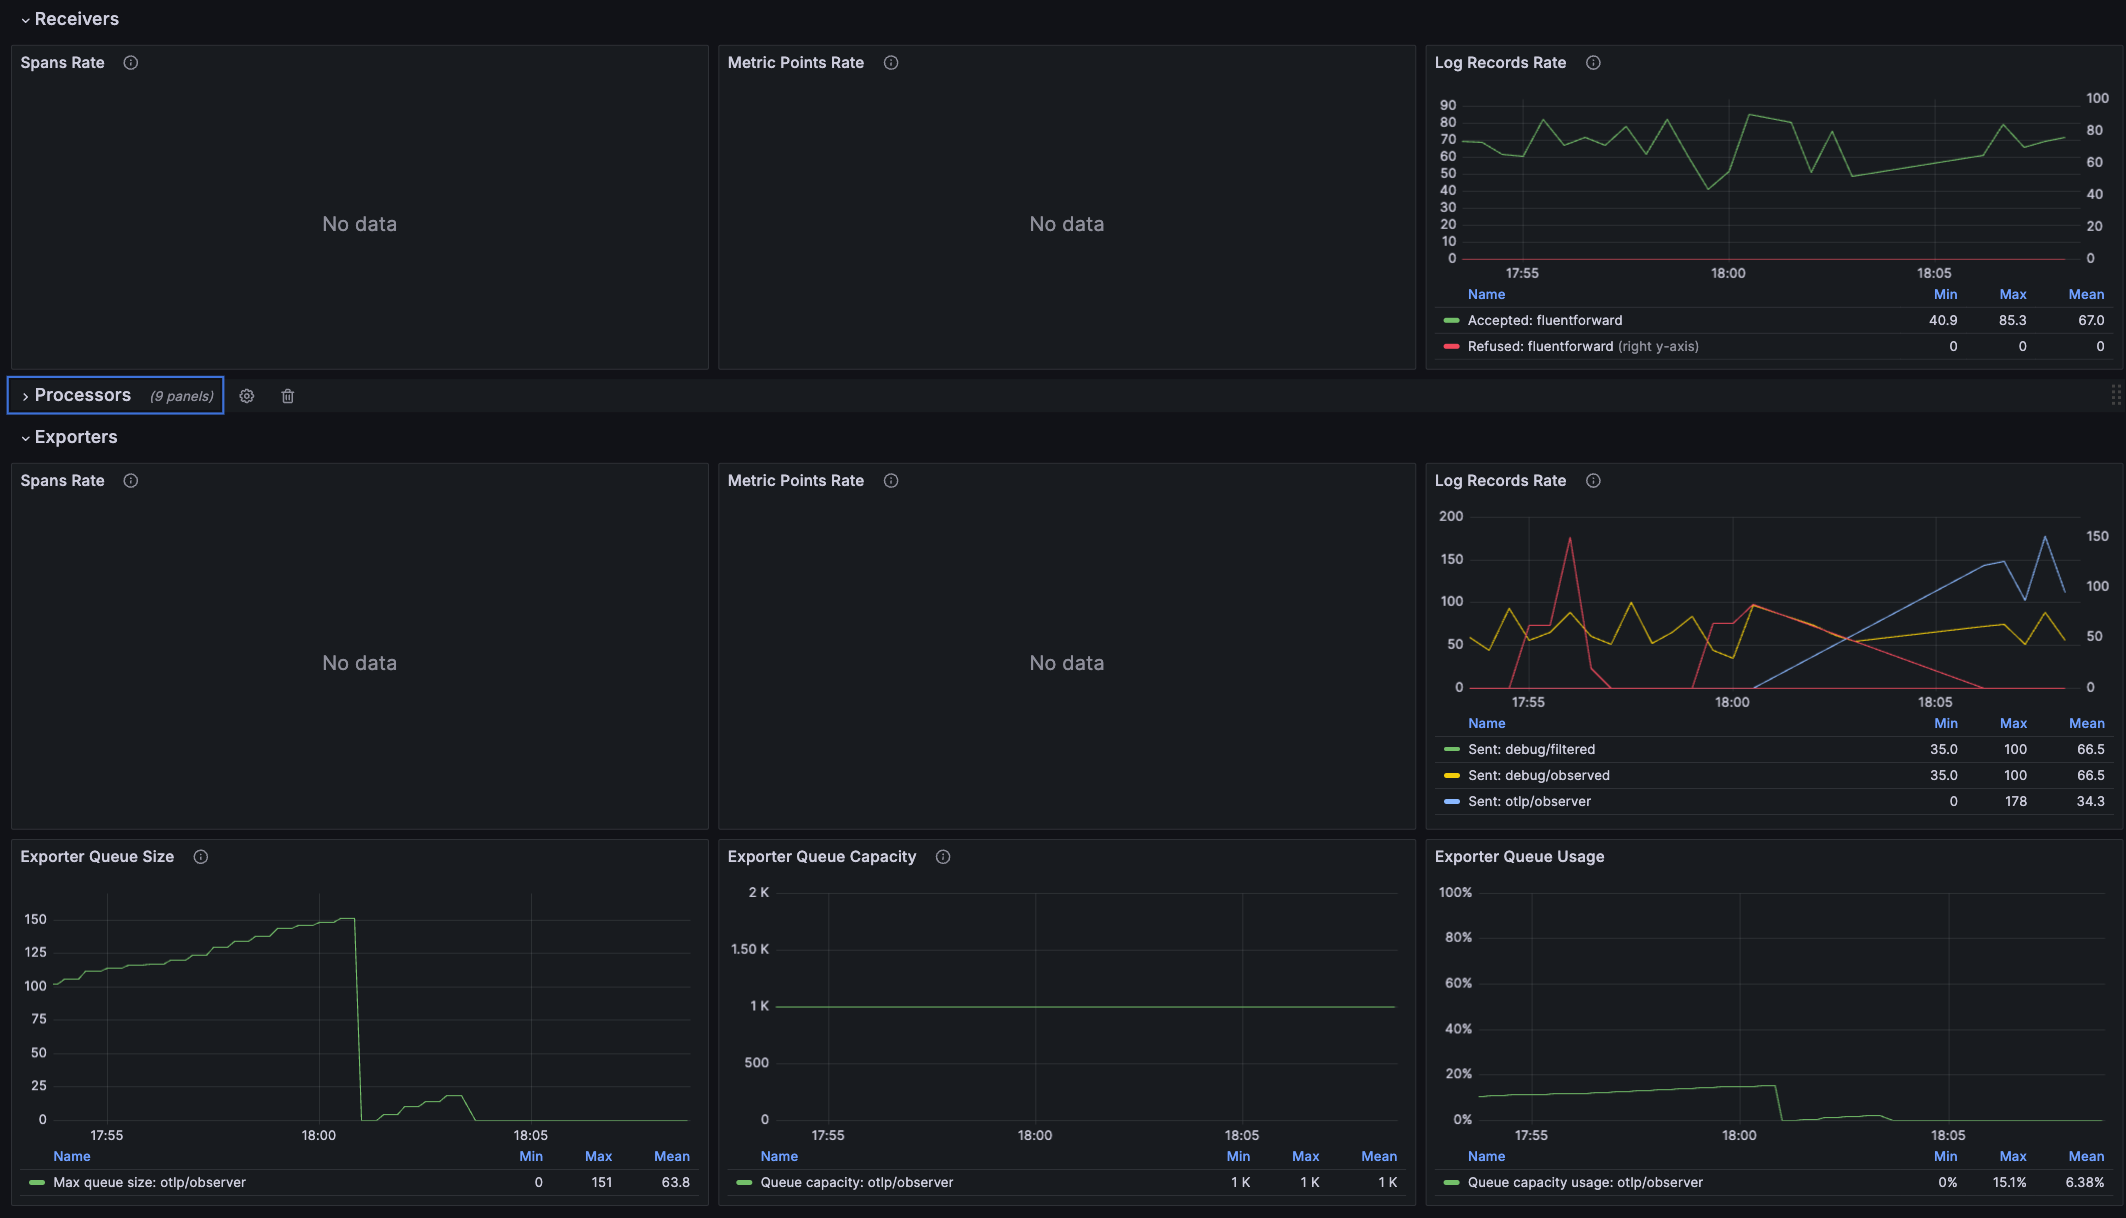
As data continues to flow you should see that your log stream export volume has significantly decreased. You should also note that the new configuration has parameterized your filter values intelligently and dynamically, based on the monitored throughput volume, per service.
Validate dynamic filtration
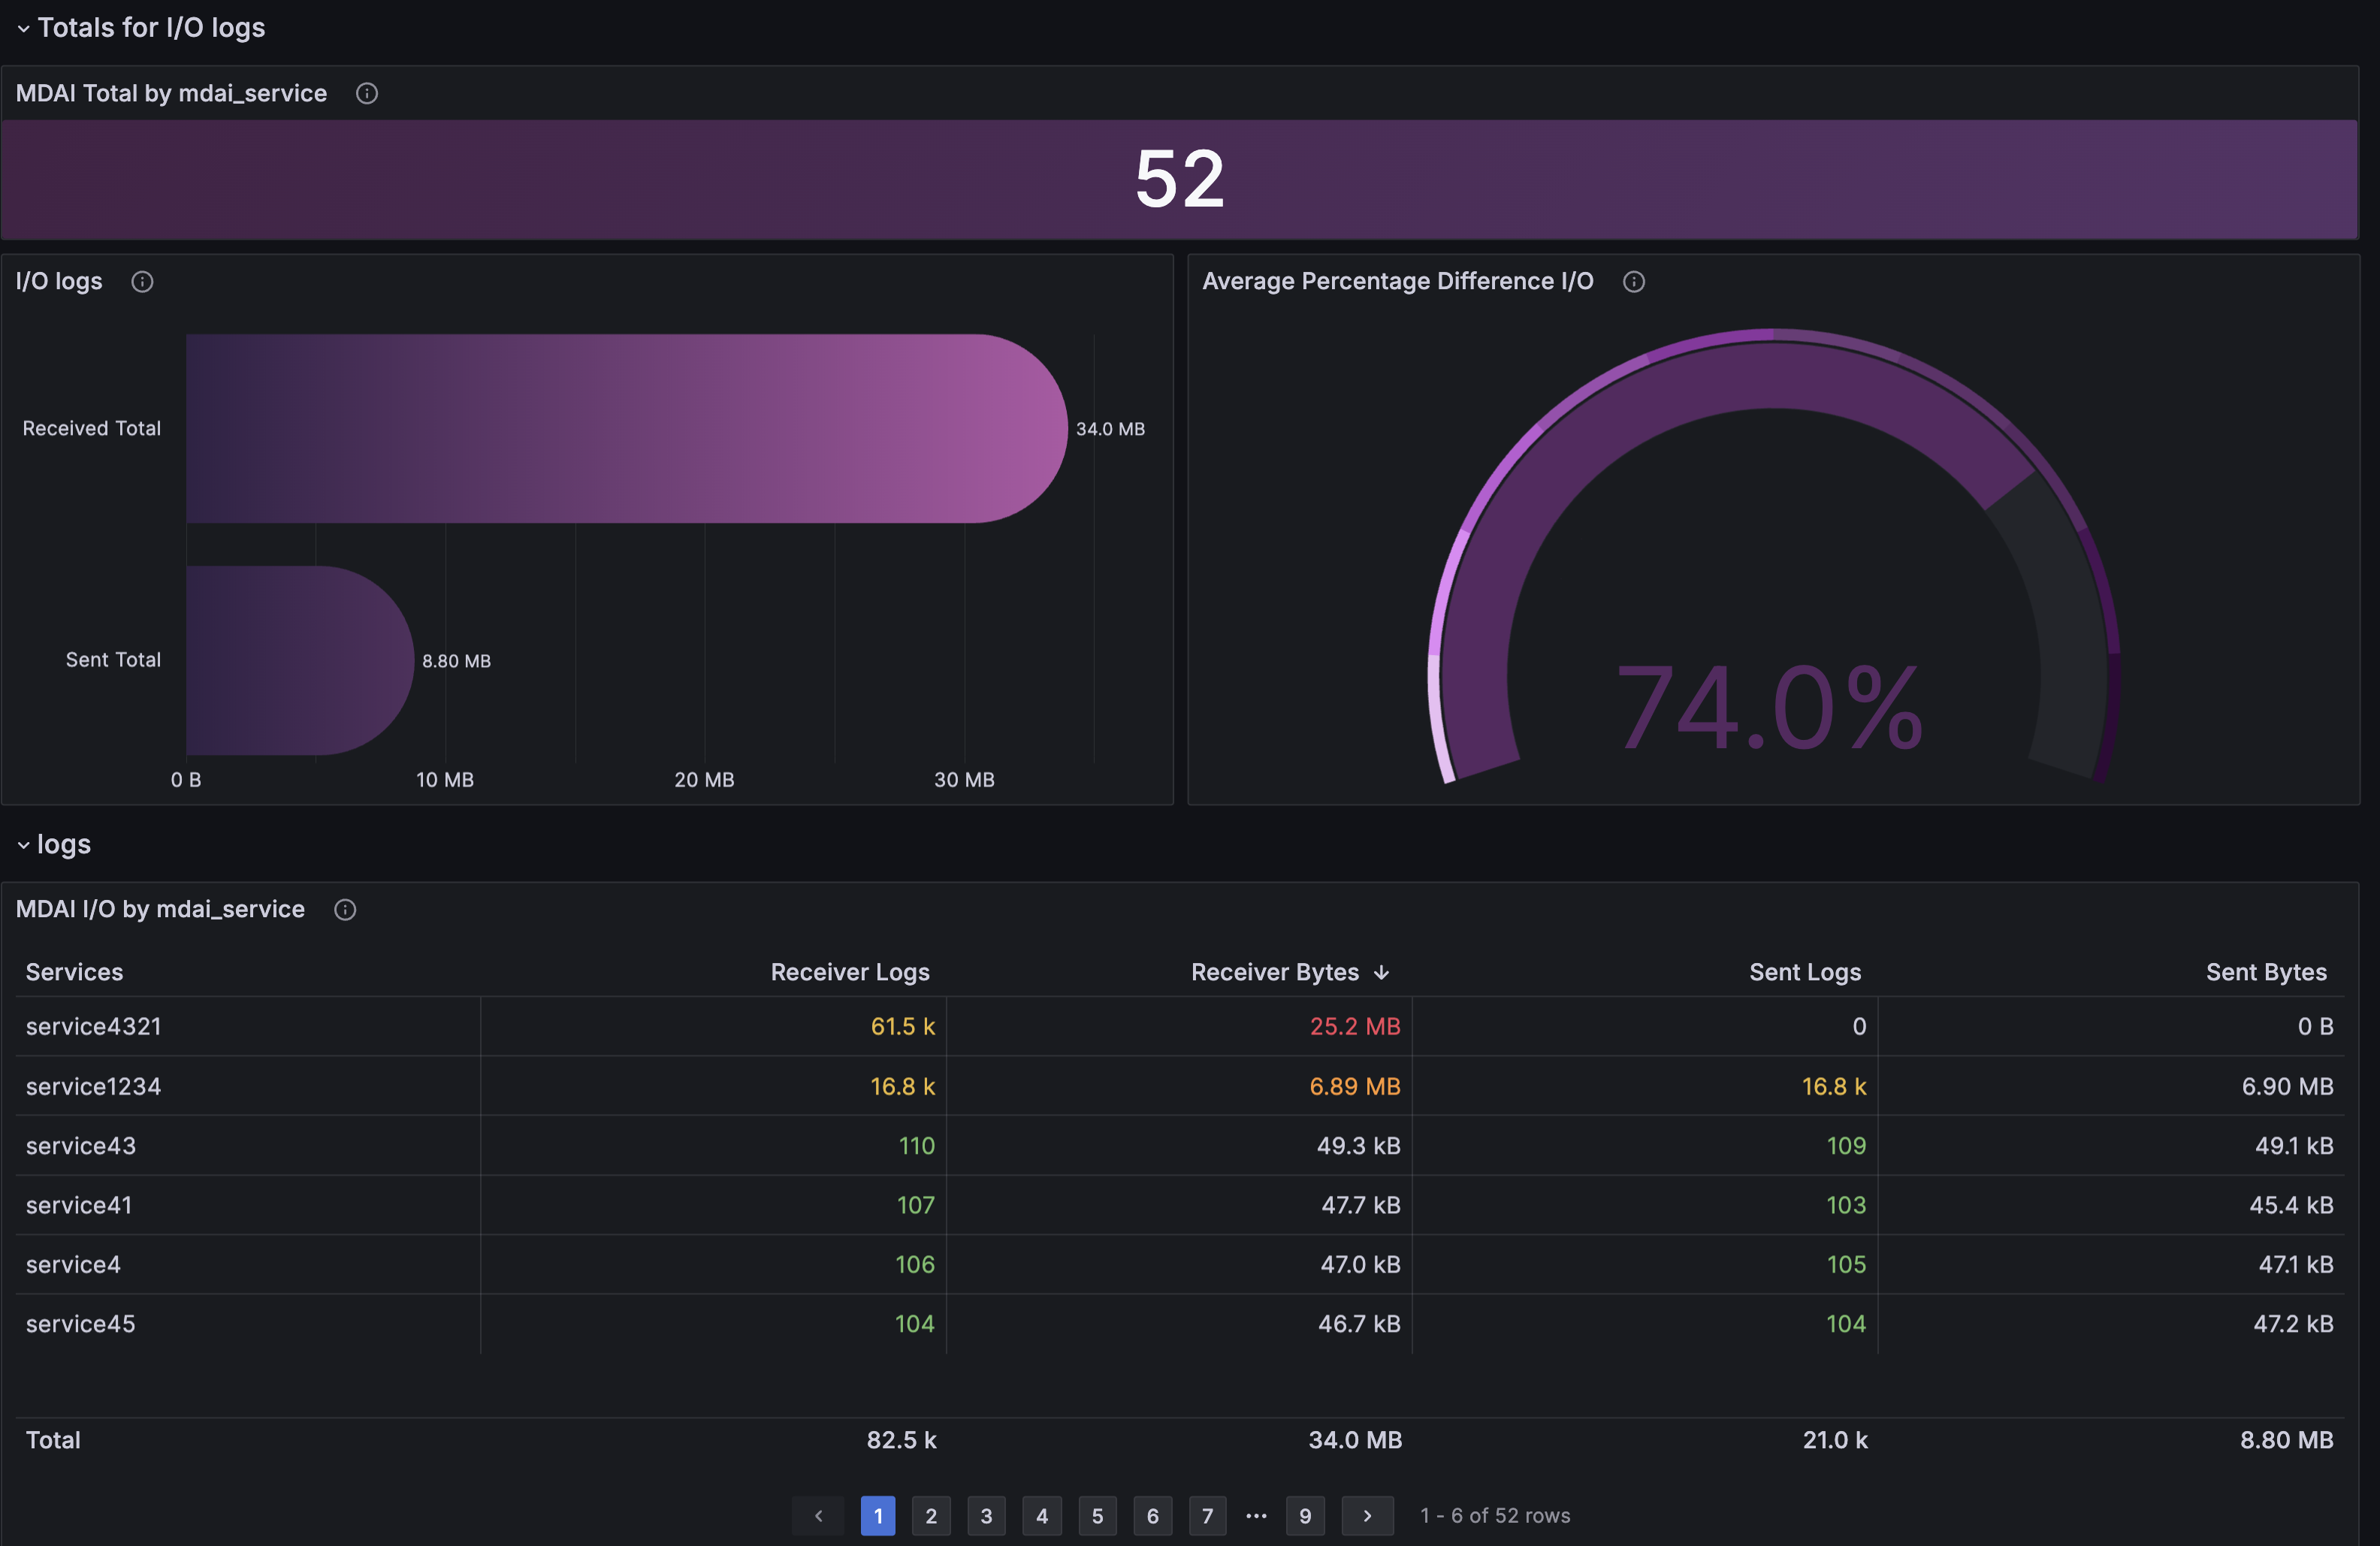
Navigate to the MDAI Data Management dashboard included in your grafana instance.
The MdaiHub creates metrics about your telemetry streams that are used to take action, like filtration, simply by monitoring and deriving insights.
The insights provided can be summarized as:
- Total services being monitored
- Total received data (by bytes)
- Total sent data (by bytes)
- Data reduction %
- Total I/O (bytes and messages) by service
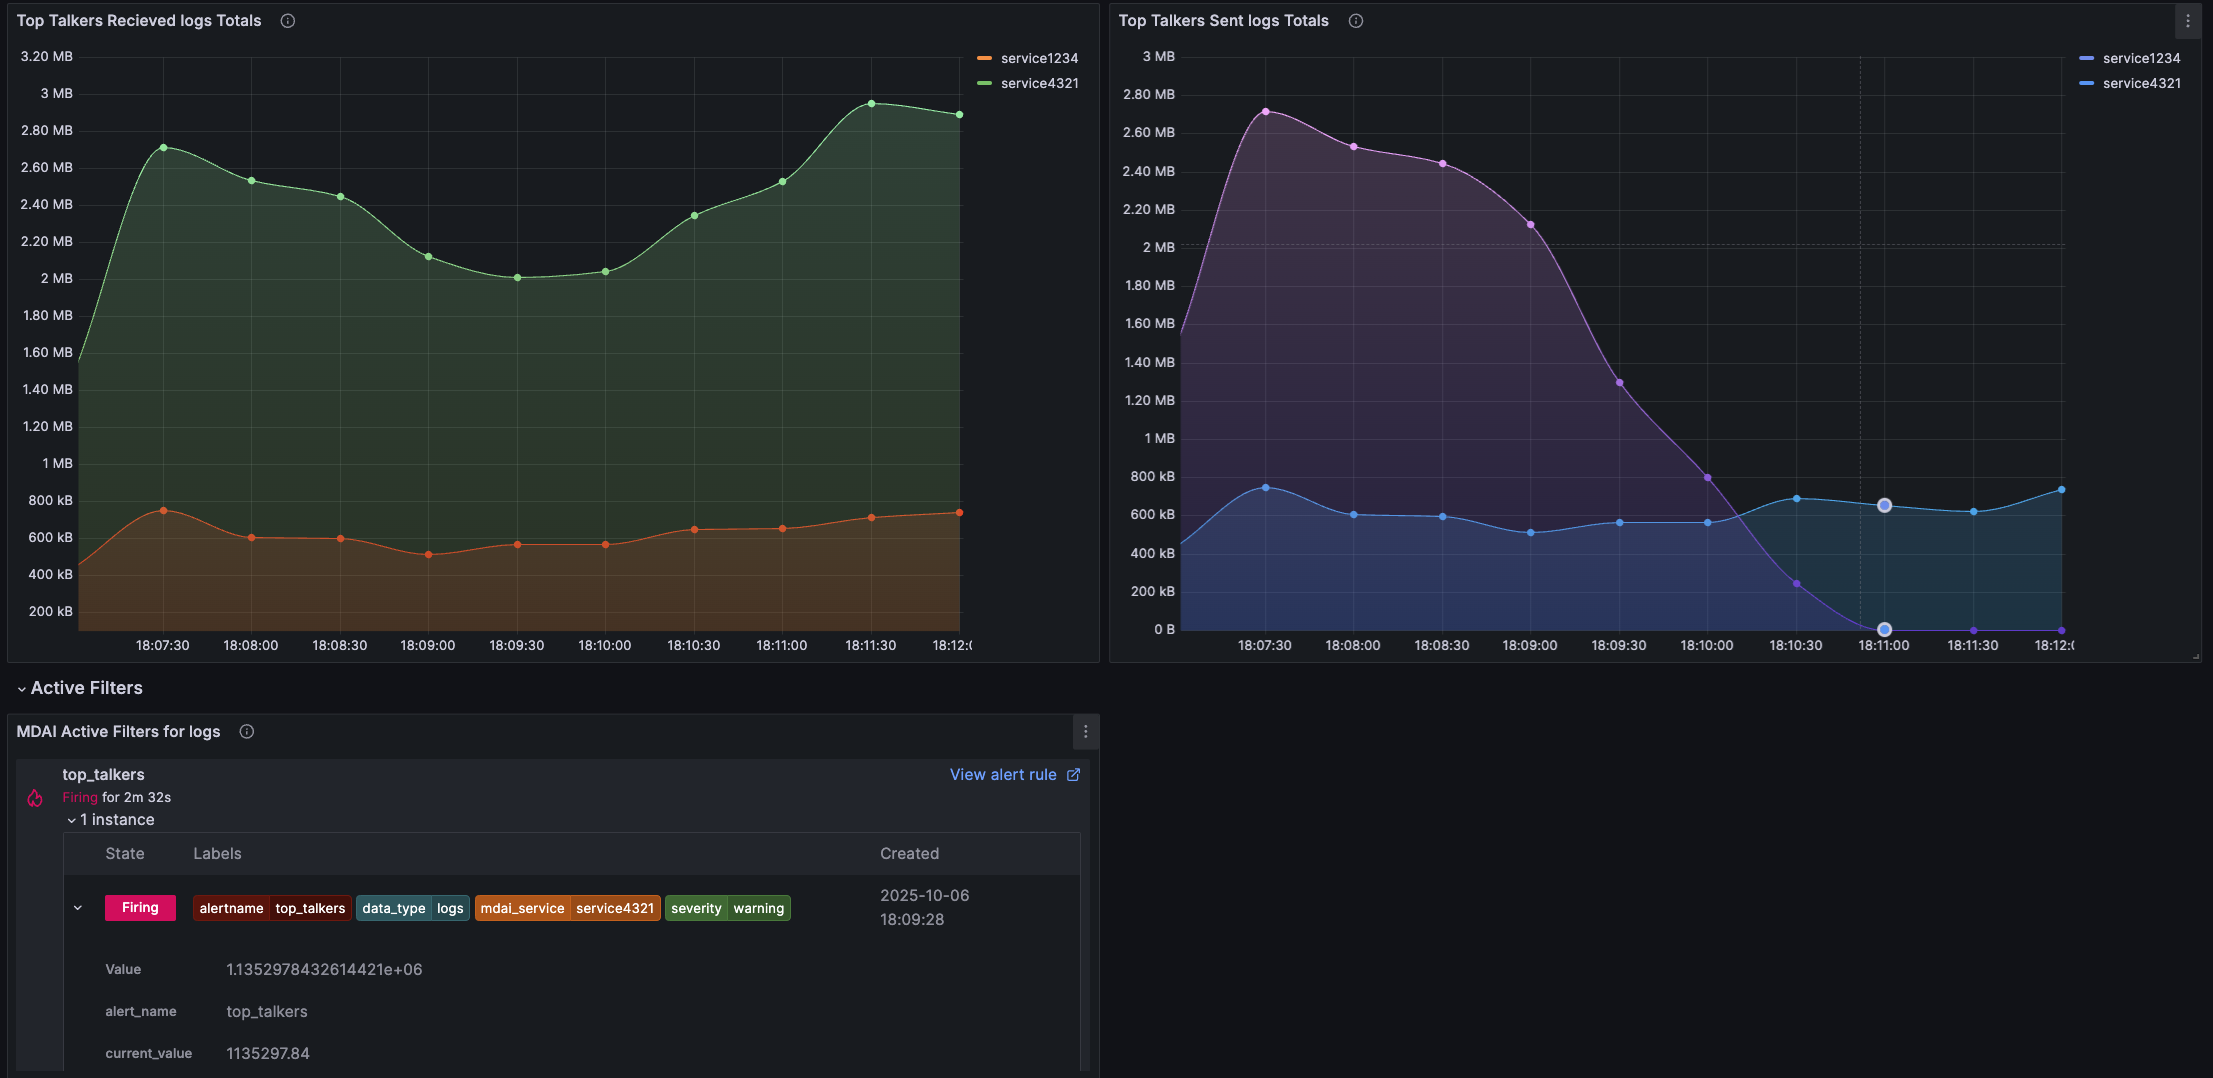
The insights provided can be summarized as:
- Top talkers, received (total message I/O, total bytes I/O)
- Top talkers, sent (total message I/O, total bytes I/O)
- Active alerts - services surpassing volume ove your configured threshold
Congrats 🎉
You’ve completed this recipe!
You’re one step closer to taking control of your observability streams and costs.
Data Filtration flow
Overview
Let’s get started with the basics
To achieve control your Data Filtration pipelines, you’ll need to…
- Create a synthetic log stream that forwards data to your collector
- Create an OpenTelemetry collector to connect your data sources to destinations
- Create an MdaiHub to create dynamic control your data streams
Let’s get started with the basics
Step 1. Introduce OTel and MdaiHub into your cluster
Provision resources for your Data Filtration pipeline
Run the following command an you’ll deploy mock data, otel, and an MDAI Hub
mdai use-case data_filtration --version 0.9.0 --workflow basicProvision synthetic data streams that represent your services
Separately, install a fluentD instance to forward your synthetic log streams to the OTel collector.
You’ll now see traffic flowing through to the collector from the synthetic services.
service1-service1000- Normal logging from these servicesservice1234- A noisy serviceservice4321- A super noisy service
helm upgrade --install --repo https://fluent.github.io/helm-charts fluent fluentd -f ./mock-data/configs/loggen_fluent.yamlValidate dataflow with Grafana
admin / mdaiNote: It may take a few minutes for data to start showing up in the dashboards.
kubectl port-forward -n mdai svc/mdai-grafana 3000:80Navigate to the OTel Dataflow Dashboard
You should see a consistent stream of data and a 1:1 ratio of logs received : logs exported
Step 2. Use mdai recipe to statically achieve use case
Apply static routing
Update your collector to utilize static routing.
mdai use_case data_filtration --version 0.9.0 --workflow staticValidate dataflow with Grafana
Navigate to the OTel Dataflow Dashboard
You should see that your log stream no longer sends the 1:1 ratio and has decreased the amount exported.
Step 3. Use MyDecisive to parameterize achieve use case
Apply static routing
Update your collector to utilize static routing.
mdai use_case data_filtration --version 0.9.0 --workflow dynamicProvision an observer
mdai apply ./0.9.0/use_cases/data_filtration/dynamic/observer.yaml -n mdaiStep 4. Validate dynamic filtration
Validate dataflow with Grafana
Navigate to the OTel Dataflow Dashboard
Before you ran new configs, your export volume was relatively high and costly with your noisy services.
As data continues to flow you should see that your log stream export volume has significantly decreased. You should also note that the new configuration has parameterized your filter values intelligently and dynamically, based on the monitored throughput volume, per service.
Validate dynamic filtration
Navigate to the MDAI Data Management dashboard included in your grafana instance.
The MdaiHub creates metrics about your telemetry streams that are used to take action, like filtration, simply by monitoring and deriving insights.
The insights provided can be summarized as:
- Total services being monitored
- Total received data (by bytes)
- Total sent data (by bytes)
- Data reduction %
- Total I/O (bytes and messages) by service
The insights provided can be summarized as:
- Top talkers, received (total message I/O, total bytes I/O)
- Top talkers, sent (total message I/O, total bytes I/O)
- Active alerts - services surpassing volume ove your configured threshold
Congrats 🎉
You’ve completed this recipe!
You’re one step closer to taking control of your observability streams and costs.
Data Filtration flow
Overview
Let’s get started with the basics
To achieve control your Data Filtration pipelines, you’ll need to…
- Create a synthetic log stream that forwards data to your collector
- Create an OpenTelemetry collector to connect your data sources to destinations
- Create an MdaiHub to create dynamic control your data streams
Let’s get started with the basics
Step 1. Introduce OTel and MdaiHub into your cluster
Provision resources for your Data Filtration pipeline
Run the following command an you’ll deploy mock data, otel, and an MDAI Hub
mdai use-case data_filtration --version 0.8.6 --workflow basicProvision synthetic data streams that represent your services
Separately, install a fluentD instance to forward your synthetic log streams to the OTel collector.
You’ll now see traffic flowing through to the collector from the synthetic services.
service1-service1000- Normal logging from these servicesservice1234- A noisy serviceservice4321- A super noisy service
helm upgrade --install --repo https://fluent.github.io/helm-charts fluent fluentd -f ./mock-data/configs/loggen_fluent.yamlValidate dataflow with Grafana
admin / mdaiNote: It may take a few minutes for data to start showing up in the dashboards.
kubectl port-forward -n mdai svc/mdai-grafana 3000:80Navigate to the OTel Dataflow Dashboard
You should see a consistent stream of data and a 1:1 ratio of logs received : logs exported
Step 2. Use mdai recipe to statically achieve use case
Apply static routing
Update your collector to utilize static routing.
mdai use_case data_filtration --version 0.8.6 --workflow staticValidate dataflow with Grafana
Navigate to the OTel Dataflow Dashboard
You should see that your log stream no longer sends the 1:1 ratio and has decreased the amount exported.
Step 3. Use MyDecisive to parameterize achieve use case
Apply static routing
Update your collector to utilize static routing.
mdai use_case data_filtration --version 0.8.6 --workflow dynamicProvision an observer
mdai apply ./0.8.6/use_cases/data_filtration/dynamic/observer.yaml -n mdaiStep 4. Validate dynamic filtration
Validate dataflow with Grafana
Navigate to the OTel Dataflow Dashboard
Before you ran new configs, your export volume was relatively high and costly with your noisy services.
As data continues to flow you should see that your log stream export volume has significantly decreased. You should also note that the new configuration has parameterized your filter values intelligently and dynamically, based on the monitored throughput volume, per service.
Validate dynamic filtration
Navigate to the MDAI Data Management dashboard included in your grafana instance.
The MdaiHub creates metrics about your telemetry streams that are used to take action, like filtration, simply by monitoring and deriving insights.
The insights provided can be summarized as:
- Total services being monitored
- Total received data (by bytes)
- Total sent data (by bytes)
- Data reduction %
- Total I/O (bytes and messages) by service
The insights provided can be summarized as:
- Top talkers, received (total message I/O, total bytes I/O)
- Top talkers, sent (total message I/O, total bytes I/O)
- Active alerts - services surpassing volume ove your configured threshold
Congrats 🎉
You’ve completed this recipe!
You’re one step closer to taking control of your observability streams and costs.
Data Filtration flow
Overview
Let’s get started with the basics
To achieve control your Data Filtration pipelines, you’ll need to…
- Create a synthetic log stream that forwards data to your collector
- Create an OpenTelemetry collector to connect your data sources to destinations
- Create an MdaiHub to create dynamic control your data streams
Let’s get started with the basics
Step 1. Introduce OTel and MdaiHub into your cluster
Provision resources for your Data Filtration pipeline
Run the following command an you’ll deploy mock data, otel, and an MDAI Hub
kubectl  apply -f ./0.8.6/use_cases/data_filtration/basic/otel.yaml -n mdai
kubectl apply -f ./mock-data/data_filtration.yaml -n mdaiProvision synthetic data streams that represent your services
Separately, install a fluentD instance to forward your synthetic log streams to the OTel collector.
You’ll now see traffic flowing through to the collector from the synthetic services.
service1-service1000- Normal logging from these servicesservice1234- A noisy serviceservice4321- A super noisy service
helm upgrade --install --repo https://fluent.github.io/helm-charts fluent fluentd -f ./mock-data/configs/loggen_fluent.yamlValidate dataflow with Grafana
admin / mdaiNote: It may take a few minutes for data to start showing up in the dashboards.
kubectl port-forward -n mdai svc/mdai-grafana 3000:80Navigate to the OTel Dataflow Dashboard
You should see a consistent stream of data and a 1:1 ratio of logs received : logs exported
Step 2. Use mdai recipe to statically achieve use case
Apply static routing
Update your collector to utilize static routing.
kubectl apply -f ./0.8.6/use_cases/data_filtration/static/otel.yaml -n mdaiValidate dataflow with Grafana
Navigate to the OTel Dataflow Dashboard
You should see that your log stream no longer sends the 1:1 ratio and has significantly decreased the amount exported.
Step 3. Use MyDecisive to parameterize achieve use case
Apply dynamic filtration
Provision dynamic resources:
kubectl  apply -f ./0.8.6/use_cases/data_filtration/dynamic/otel.yaml -n mdai
kubectl apply -f ./0.8.6/use_cases/data_filtration/dynamic/hub.yaml -n mdaiProvision an observer
mdai apply ./0.8.6/use_cases/data_filtration/dynamic/observer.yaml -n mdaiStep 4. Validate dynamic filtration
Validate dataflow with Grafana
Navigate to the OTel Dataflow Dashboard
Before you ran new configs, your export volume was relatively high and costly with your noisy services.
As data continues to flow you should see that your log stream export volume has significantly decreased. You should also note that the new configuration has parameterized your filter values intelligently and dynamically, based on the monitored throughput volume, per service.
Validate dynamic filtration
Navigate to the MDAI Data Management dashboard included in your grafana instance.
The MdaiHub creates metrics about your telemetry streams that are used to take action, like filtration, simply by monitoring and deriving insights.
The insights provided can be summarized as:
- Total services being monitored
- Total received data (by bytes)
- Total sent data (by bytes)
- Data reduction %
- Total I/O (bytes and messages) by service
The insights provided can be summarized as:
- Top talkers, received (total message I/O, total bytes I/O)
- Top talkers, sent (total message I/O, total bytes I/O)
- Active alerts - services surpassing volume ove your configured threshold
Congrats 🎉
You’ve completed this recipe!
You’re one step closer to taking control of your observability streams and costs.
Data Filtration flow
Overview
Let’s get started with the basics
To achieve control your Data Filtration pipelines, you’ll need to…
- Create a synthetic log stream that forwards data to your collector
- Create an OpenTelemetry collector to connect your data sources to destinations
- Create an MdaiHub to create dynamic control your data streams
Let’s get started with the basics
Step 1. Introduce OTel and MdaiHub into your cluster
Provision resources for your Data Filtration pipeline
Run the following command an you’ll deploy mock data, otel, and an MDAI Hub
kubectl  apply -f ./0.9.0/use_cases/data_filtration/basic/otel.yaml -n mdai
kubectl apply -f ./mock-data/data_filtration.yaml -n mdaiProvision synthetic data streams that represent your services
Separately, install a fluentD instance to forward your synthetic log streams to the OTel collector.
You’ll now see traffic flowing through to the collector from the synthetic services.
service1-service1000- Normal logging from these servicesservice1234- A noisy serviceservice4321- A super noisy service
helm upgrade --install --repo https://fluent.github.io/helm-charts fluent fluentd -f ./mock-data/configs/loggen_fluent.yamlValidate dataflow with Grafana
admin / mdaiNote: It may take a few minutes for data to start showing up in the dashboards.
kubectl port-forward -n mdai svc/mdai-grafana 3000:80Navigate to the OTel Dataflow Dashboard
You should see a consistent stream of data and a 1:1 ratio of logs received : logs exported
Step 2. Use mdai recipe to statically achieve use case
Apply static routing
Update your collector to utilize static routing.
kubectl apply -f ./0.9.0/use_cases/data_filtration/static/otel.yaml -n mdaiValidate dataflow with Grafana
Navigate to the OTel Dataflow Dashboard
You should see that your log stream no longer sends the 1:1 ratio and has significantly decreased the amount exported.
Step 3. Use MyDecisive to parameterize achieve use case
Apply dynamic filtration
Provision dynamic resources:
kubectl  apply -f ./0.9.0/use_cases/data_filtration/dynamic/otel.yaml -n mdai
kubectl apply -f ./0.9.0/use_cases/data_filtration/dynamic/hub.yaml -n mdaiProvision an observer
mdai apply ./0.9.0/use_cases/data_filtration/dynamic/observer.yaml -n mdaiStep 4. Validate dynamic filtration
Validate dataflow with Grafana
Navigate to the OTel Dataflow Dashboard
Before you ran new configs, your export volume was relatively high and costly with your noisy services.
As data continues to flow you should see that your log stream export volume has significantly decreased. You should also note that the new configuration has parameterized your filter values intelligently and dynamically, based on the monitored throughput volume, per service.
Validate dynamic filtration
Navigate to the MDAI Data Management dashboard included in your grafana instance.
The MdaiHub creates metrics about your telemetry streams that are used to take action, like filtration, simply by monitoring and deriving insights.
The insights provided can be summarized as:
- Total services being monitored
- Total received data (by bytes)
- Total sent data (by bytes)
- Data reduction %
- Total I/O (bytes and messages) by service
The insights provided can be summarized as:
- Top talkers, received (total message I/O, total bytes I/O)
- Top talkers, sent (total message I/O, total bytes I/O)
- Active alerts - services surpassing volume ove your configured threshold
Congrats 🎉
You’ve completed this recipe!
You’re one step closer to taking control of your observability streams and costs.
Data Filtration flow
Overview
Let’s get started with the basics
To achieve control your Data Filtration pipelines, you’ll need to…
- Create a synthetic log stream that forwards data to your collector
- Create an OpenTelemetry collector to connect your data sources to destinations
- Create an MdaiHub to create dynamic control your data streams
Let’s get started with the basics
Step 1. Introduce OTel and MdaiHub into your cluster
Provision resources for your Data Filtration pipeline
Run the following command an you’ll deploy mock data, otel, and an MDAI Hub
kubectl  apply -f ./0.8.6/use_cases/data_filtration/basic/otel.yaml -n mdai
  kubectl  apply -f ./mock-data/data_filtration.yaml -n mdai
Provision synthetic data streams that represent your services
Separately, install a fluentD instance to forward your synthetic log streams to the OTel collector.
You’ll now see traffic flowing through to the collector from the synthetic services.
service1-service1000- Normal logging from these servicesservice1234- A noisy serviceservice4321- A super noisy service
helm upgrade --install --repo https://fluent.github.io/helm-charts fluent fluentd -f ./mock-data/configs/loggen_fluent.yamlValidate dataflow with Grafana
admin / mdaiNote: It may take a few minutes for data to start showing up in the dashboards.
kubectl port-forward -n mdai svc/mdai-grafana 3000:80Navigate to the OTel Dataflow Dashboard
You should see a consistent stream of data and a 1:1 ratio of logs received : logs exported
Step 2. Use mdai recipe to statically achieve use case
Apply static routing
Update your collector to utilize static routing.
kubectl apply -f ./0.8.6/use_cases/data_filtration/static/otel.yaml -n mdaiValidate dataflow with Grafana
Navigate to the OTel Dataflow Dashboard
You should see that your log stream no longer sends the 1:1 ratio and has significantly decreased the amount exported.
Step 3. Use MyDecisive to parameterize achieve use case
Apply dynamic filtration
Provision dynamic resources:
kubectl  apply -f ./0.8.6/use_cases/data_filtration/dynamic/otel.yaml -n mdai
  kubectl  apply -f ./0.8.6/use_cases/data_filtration/dynamic/hub.yaml -n mdai
Provision an observer
mdai apply ./0.8.6/use_cases/data_filtration/dynamic/observer.yaml -n mdaiStep 4. Validate dynamic filtration
Validate dataflow with Grafana
Navigate to the OTel Dataflow Dashboard
Before you ran new configs, your export volume was relatively high and costly with your noisy services.
As data continues to flow you should see that your log stream export volume has significantly decreased. You should also note that the new configuration has parameterized your filter values intelligently and dynamically, based on the monitored throughput volume, per service.
Validate dynamic filtration
Navigate to the MDAI Data Management dashboard included in your grafana instance.
The MdaiHub creates metrics about your telemetry streams that are used to take action, like filtration, simply by monitoring and deriving insights.
The insights provided can be summarized as:
- Total services being monitored
- Total received data (by bytes)
- Total sent data (by bytes)
- Data reduction %
- Total I/O (bytes and messages) by service
The insights provided can be summarized as:
- Top talkers, received (total message I/O, total bytes I/O)
- Top talkers, sent (total message I/O, total bytes I/O)
- Active alerts - services surpassing volume ove your configured threshold
Congrats 🎉
You’ve completed this recipe!
You’re one step closer to taking control of your observability streams and costs.