Compliance
Use case
Guarantee regulatory compliance by forking every telemetry stream—no matter where the data is routed, filtered, or sampled—and persisting a full, unmodified copy into long-term cold or glacial storage for audit and retention needs.
Prerequisites
- Long-term storage backend (cold/glacial tiers)
- Fork/tee in pipeline
- Policy/config to duplicate all streams
- IAM & encryption keys
Choose your preferred self-guided experience
Compliance flow
Overview
Let’s get started with the basics
To achieve control your Compliance pipelines, you’ll need to…
- Create a synthetic log stream that forwards data to your collector
- Create an OpenTelemetry collector to connect your data sources to destinations
- Create an MdaiHub to create dynamic control your data streams
Let’s get started with the basics
Step 1. Introduce OTel and MdaiHub into your cluster
Provision resources for your Compliance pipeline
Run the following command an you’ll deploy mock data, otel, and an MDAI Hub
mdai use-case compliance --version 0.8.6 --workflow basicValidate dataflow with Grafana
admin / mdaikubectl port-forward -n mdai svc/mdai-grafana 3000:80Navigate to the OTel Dataflow Dashboard
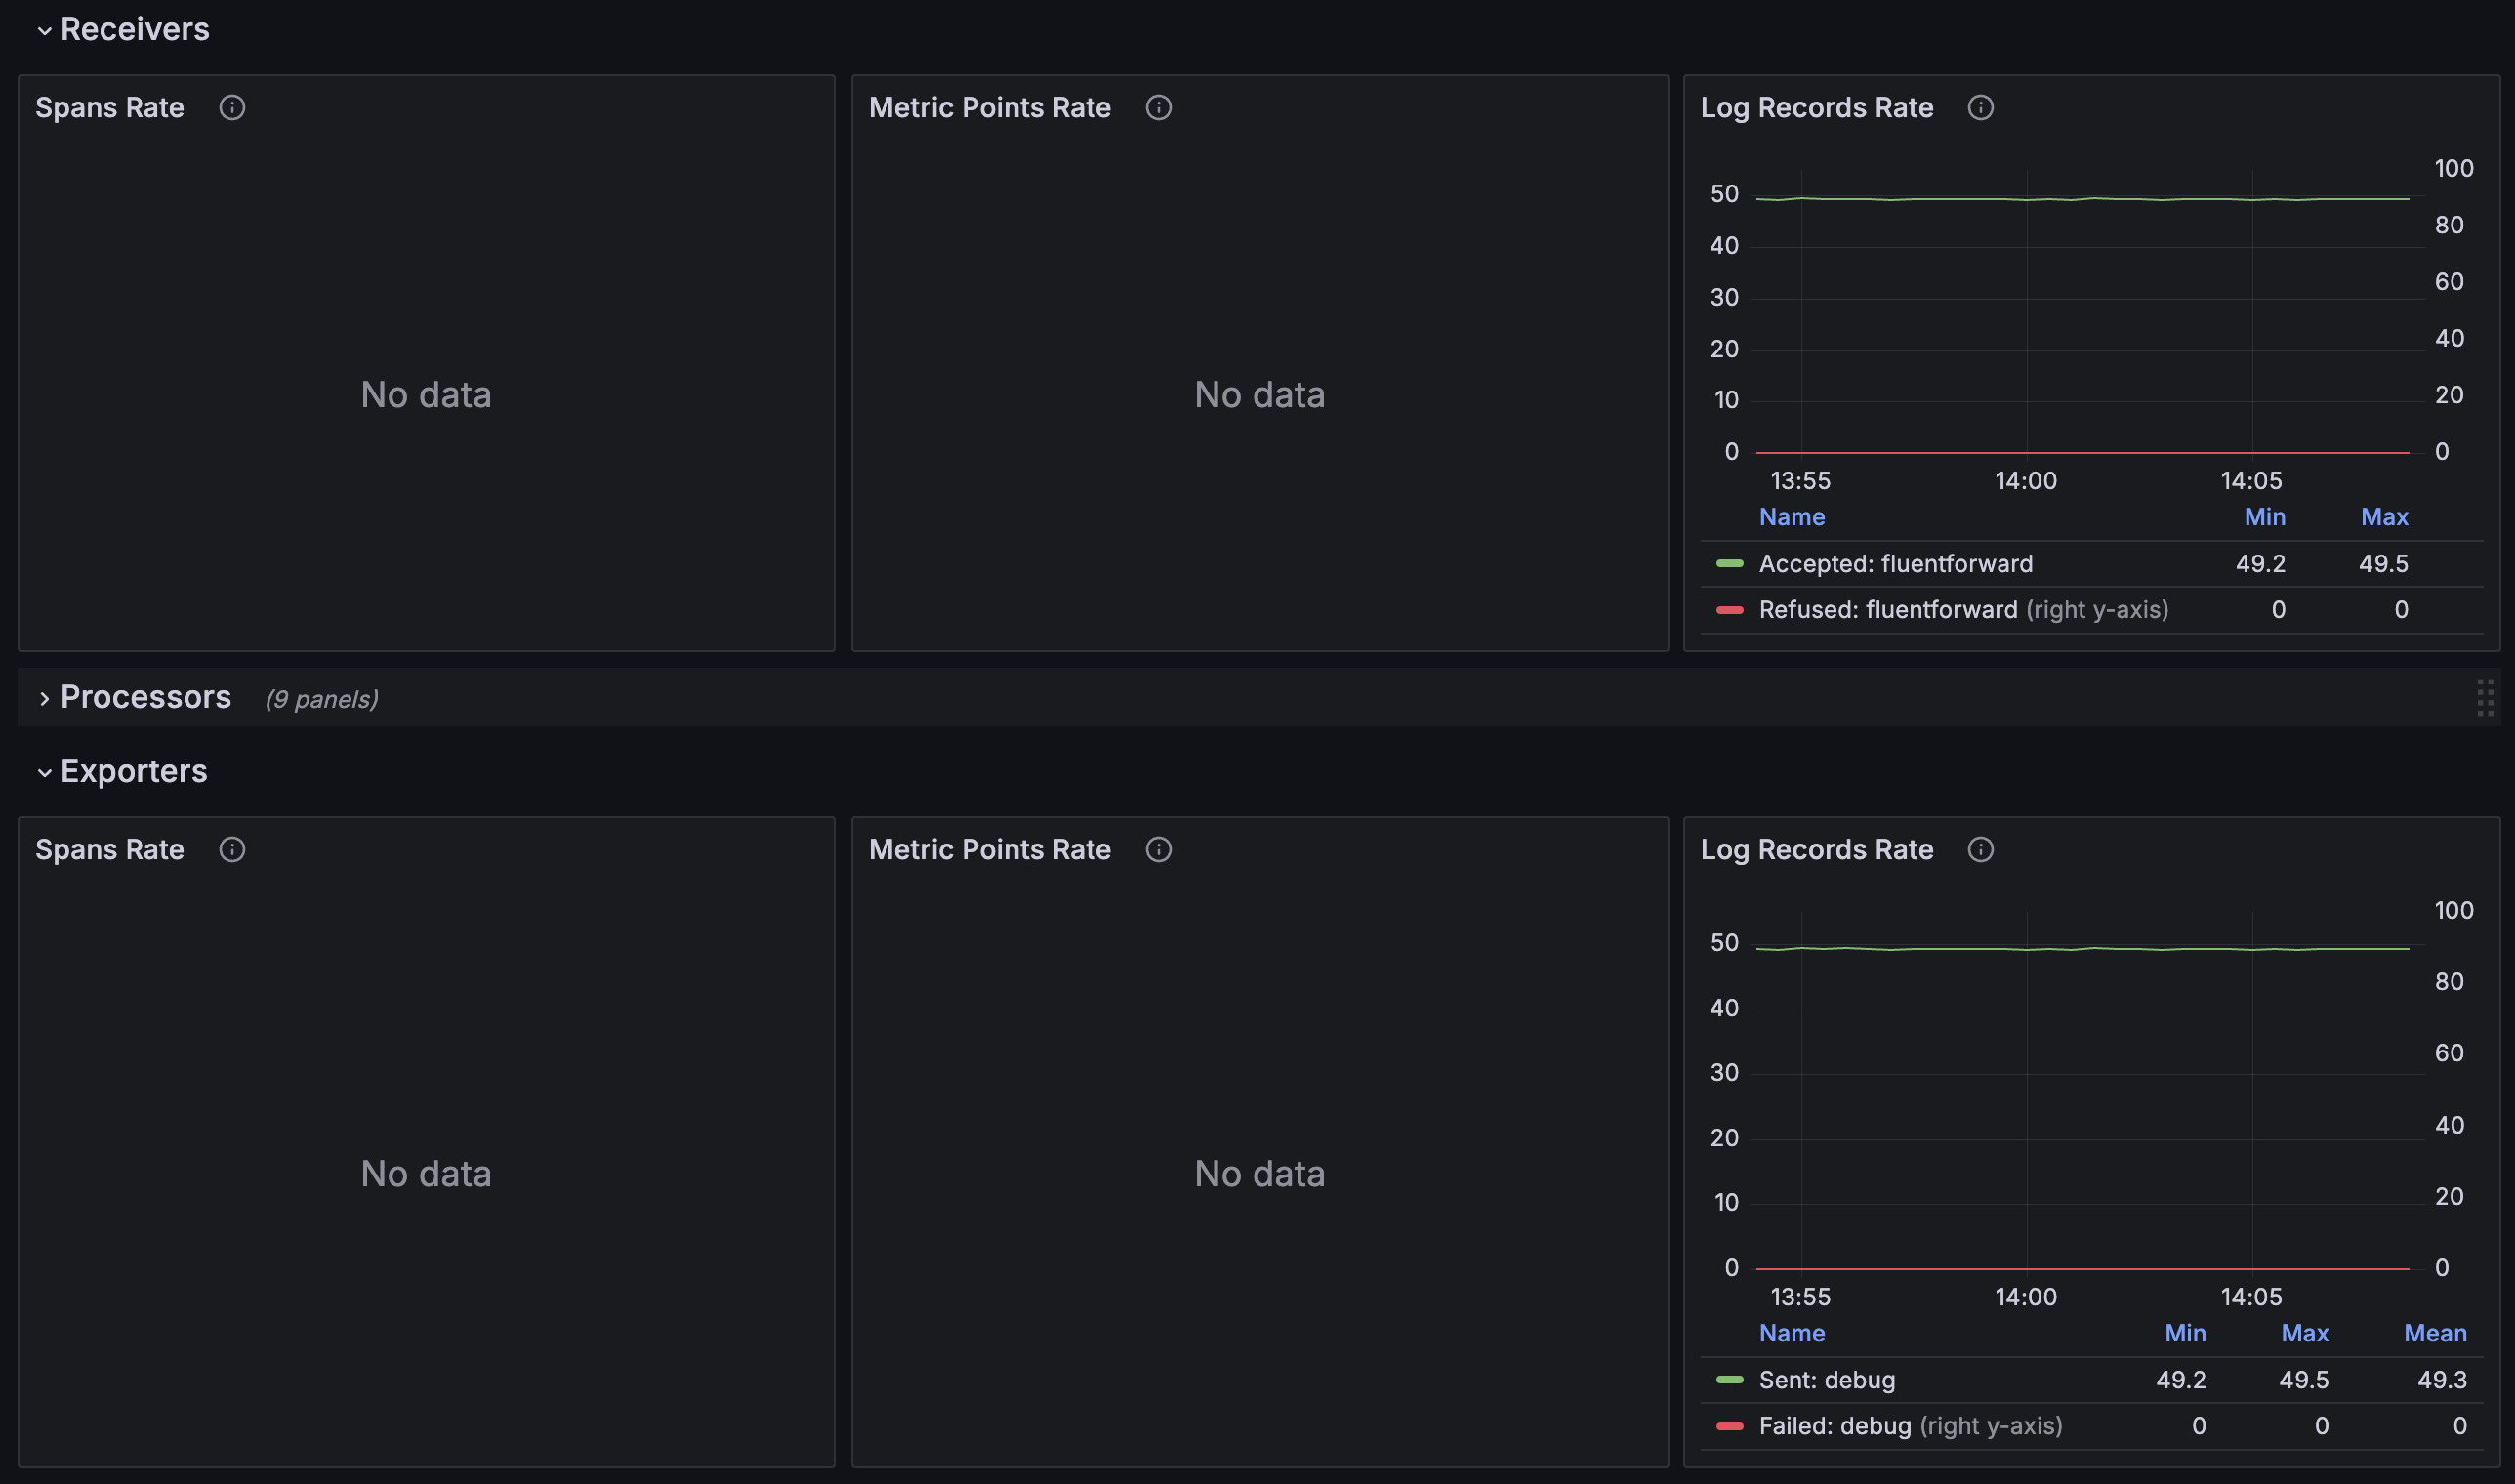
You should see a consistent stream of data and a 1:1 ratio of logs received : logs exported
Step 2. use mdai recipe to statically achieve use case
Apply static routing
Update your collector to utilize static routing.
mdai use_case compliance --version 0.8.6 --workflow staticValidate dataflow with Grafana
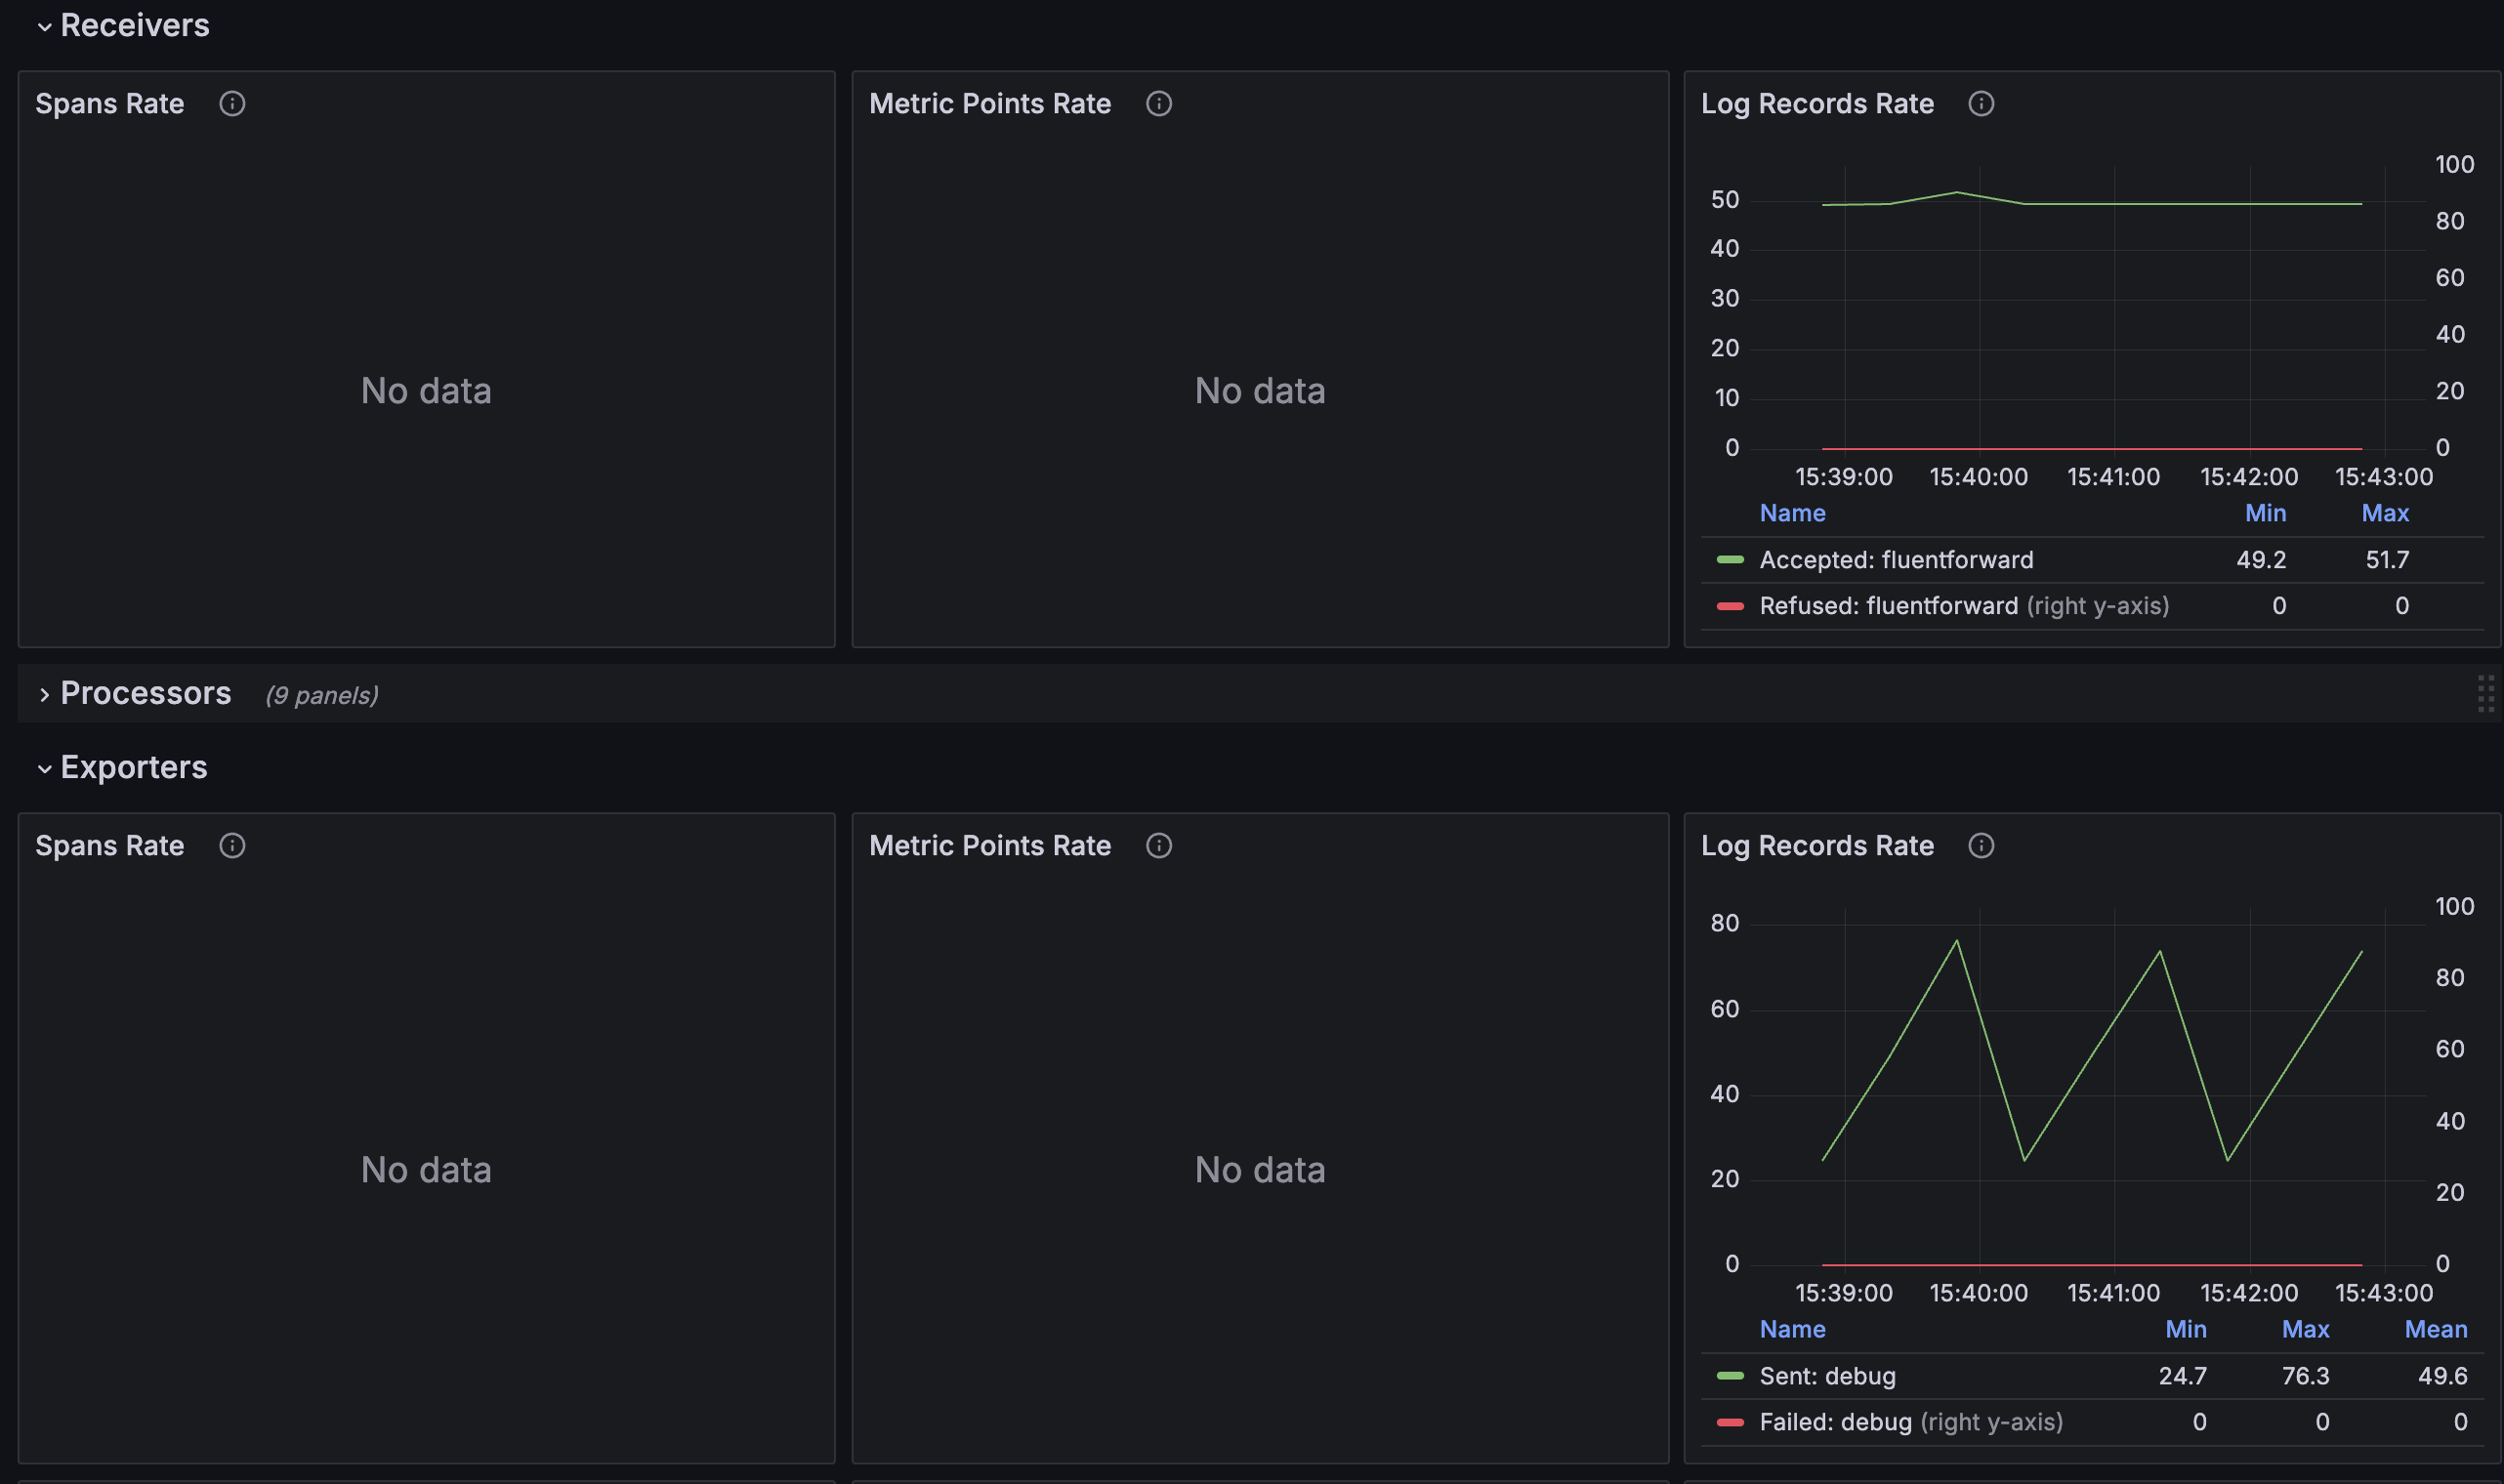
You should see that your log stream no longer sends the 1:1 ratio and has decreased the amount exported.
Step 3. Use MyDecisive to parameterize achieve use case
Coming soon…

Congrats 🎉
You’ve completed this recipe!
You’re one step closer to reducing your observability costs and owning your data.
Compliance flow
Overview
Let’s get started with the basics
To achieve control your Compliance pipelines, you’ll need to…
- Create a synthetic log stream that forwards data to your collector
- Create an OpenTelemetry collector to connect your data sources to destinations
- Create an MdaiHub to create dynamic control your data streams
Let’s get started with the basics
Step 1. Introduce OTel and MdaiHub into your cluster
Provision resources for your Compliance pipeline
Run the following command an you’ll deploy mock data, otel, and an MDAI Hub
mdai use-case compliance --version 0.9.0 --workflow basicValidate dataflow with Grafana
admin / mdaikubectl port-forward -n mdai svc/mdai-grafana 3000:80Navigate to the OTel Dataflow Dashboard
You should see a consistent stream of data and a 1:1 ratio of logs received : logs exported
Step 2. use mdai recipe to statically achieve use case
Apply static routing
Update your collector to utilize static routing.
mdai use_case compliance --version 0.9.0 --workflow staticValidate dataflow with Grafana
You should see that your log stream no longer sends the 1:1 ratio and has decreased the amount exported.
Step 3. Use MyDecisive to parameterize achieve use case
Coming soon…
Congrats 🎉
You’ve completed this recipe!
You’re one step closer to reducing your observability costs and owning your data.
Compliance flow
Overview
Let’s get started with the basics
To achieve control your Compliance pipelines, you’ll need to…
- Create a synthetic log stream that forwards data to your collector
- Create an OpenTelemetry collector to connect your data sources to destinations
- Create an MdaiHub to create dynamic control your data streams
Let’s get started with the basics
Step 1. Introduce OTel and MdaiHub into your cluster
Provision resources for your Compliance pipeline
Run the following command an you’ll deploy mock data, otel, and an MDAI Hub
mdai use-case compliance --version 0.8.6 --workflow basicValidate dataflow with Grafana
admin / mdaikubectl port-forward -n mdai svc/mdai-grafana 3000:80Navigate to the OTel Dataflow Dashboard
You should see a consistent stream of data and a 1:1 ratio of logs received : logs exported
Step 2. use mdai recipe to statically achieve use case
Apply static routing
Update your collector to utilize static routing.
mdai use_case compliance --version 0.8.6 --workflow staticValidate dataflow with Grafana
You should see that your log stream no longer sends the 1:1 ratio and has decreased the amount exported.
Step 3. Use MyDecisive to parameterize achieve use case
Coming soon…
Congrats 🎉
You’ve completed this recipe!
You’re one step closer to reducing your observability costs and owning your data.
Compliance flow
Overview
Let’s get started with the basics
To achieve control your Compliance pipelines, you’ll need to…
- Create a synthetic log stream that forwards data to your collector
- Create an OpenTelemetry collector to connect your data sources to destinations
- Create an MdaiHub to create dynamic control your data streams
Let’s get started with the basics
Step 1. Introduce OTel and MdaiHub into your cluster
Start generating data
Kick off your synthetic data generators. This will represent log streams from your services and/or infra in your existing ecosystem.
kubectl apply -f ./mock-data/compliance.yaml -n mdaiProvision resources for your Compliance pipeline
Run the following commands and you’ll see these resources created.
kubectl apply -f ./0.8.6/use_cases/compliance/basic/otel.yaml -n mdaiValidate dataflow with Grafana
admin / mdaikubectl port-forward -n mdai svc/mdai-grafana 3000:80Navigate to the OTel Dataflow Dashboard
You should see a consistent stream of data and a 1:1 ratio of logs received : logs exported
Step 2. use mdai recipe to statically achieve use case
Apply static routing
Update your collector to utilize static routing.
kubectl apply -f ./0.8.6/use_cases/compliance/static/otel.yaml -n mdaiValidate dataflow with Grafana
You should see that your log stream no longer sends the 1:1 ratio and has decreased the amount exported.
Step 3. Use MyDecisive to parameterize achieve use case
Coming soon…
Congrats 🎉
You’ve completed this recipe!
You’re one step closer to reducing your observability costs and owning your data.
Compliance flow
Overview
Let’s get started with the basics
To achieve control your Compliance pipelines, you’ll need to…
- Create a synthetic log stream that forwards data to your collector
- Create an OpenTelemetry collector to connect your data sources to destinations
- Create an MdaiHub to create dynamic control your data streams
Let’s get started with the basics
Step 1. Introduce OTel and MdaiHub into your cluster
Start generating data
Kick off your synthetic data generators. This will represent log streams from your services and/or infra in your existing ecosystem.
kubectl apply -f ./mock-data/compliance.yaml -n mdaiProvision resources for your Compliance pipeline
Run the following commands and you’ll see these resources created.
kubectl apply -f ./0.9.0/use_cases/compliance/basic/otel.yaml -n mdaiValidate dataflow with Grafana
admin / mdaikubectl port-forward -n mdai svc/mdai-grafana 3000:80Navigate to the OTel Dataflow Dashboard
You should see a consistent stream of data and a 1:1 ratio of logs received : logs exported
Step 2. use mdai recipe to statically achieve use case
Apply static routing
Update your collector to utilize static routing.
kubectl apply -f ./0.9.0/use_cases/compliance/static/otel.yaml -n mdaiValidate dataflow with Grafana
You should see that your log stream no longer sends the 1:1 ratio and has decreased the amount exported.
Step 3. Use MyDecisive to parameterize achieve use case
Coming soon…
Congrats 🎉
You’ve completed this recipe!
You’re one step closer to reducing your observability costs and owning your data.
Compliance flow
Overview
Let’s get started with the basics
To achieve control your Compliance pipelines, you’ll need to…
- Create a synthetic log stream that forwards data to your collector
- Create an OpenTelemetry collector to connect your data sources to destinations
- Create an MdaiHub to create dynamic control your data streams
Let’s get started with the basics
Step 1. Introduce OTel and MdaiHub into your cluster
Start generating data
Kick off your synthetic data generators. This will represent log streams from your services and/or infra in your existing ecosystem.
kubectl apply -f ./mock-data/compliance.yaml -n mdaiProvision resources for your Compliance pipeline
Run the following commands and you’ll see these resources created.
kubectl apply -f ./0.8.6/use_cases/compliance/basic/otel.yaml -n mdaiValidate dataflow with Grafana
admin / mdaikubectl port-forward -n mdai svc/mdai-grafana 3000:80Navigate to the OTel Dataflow Dashboard
You should see a consistent stream of data and a 1:1 ratio of logs received : logs exported
Step 2. use mdai recipe to statically achieve use case
Apply static routing
Update your collector to utilize static routing.
kubectl apply -f ./0.8.6/use_cases/compliance/static/otel.yaml -n mdaiValidate dataflow with Grafana
You should see that your log stream no longer sends the 1:1 ratio and has decreased the amount exported.
Step 3. Use MyDecisive to parameterize achieve use case
Coming soon…
Congrats 🎉
You’ve completed this recipe!
You’re one step closer to reducing your observability costs and owning your data.